Search for all pages containing Mean


Mean
Details
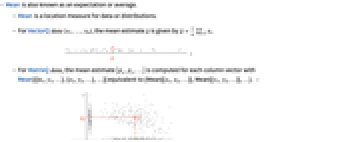
- Mean is also known as an expectation or average.
- Mean is a location measure for data or distributions.
- For VectorQ data
 , the mean estimate
  is given by
  .
. - For MatrixQ data, the mean estimate
 is computed for each column vector with Mean[{{x1,y1,…},{x2,y2,…},…}] equivalent to {Mean[{x1,x2,…}],Mean[{y1,y2,…}],…}. »
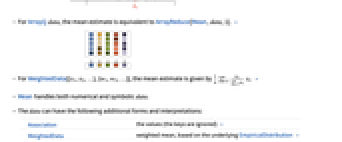
 - For ArrayQ data, the mean estimate is equivalent to ArrayReduce[Mean,data,1]. »
- For WeightedData[{x1,x2,…},{w1,w2,…}], the mean estimate is given by
 . »
. » - Mean handles both numerical and symbolic data.
- The data can have the following additional forms and interpretations:
-
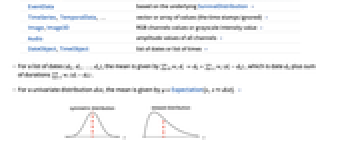
Association the values (the keys are ignored) » WeightedData weighted mean, based on the underlying EmpiricalDistribution » EventData based on the underlying SurvivalDistribution » TimeSeries, TemporalData, … vector or array of values (the time stamps ignored) » Image,Image3D RGB channels values or grayscale intensity value » Audio amplitude values of all channels » DateObject,TimeObject list of dates or list of times » - For a list of dates
 , the mean is given by
  , which is date
  plus sum of durations
  .
. - For a univariate distribution dist, the mean is given by μ=Expectation[x,xdist]. »
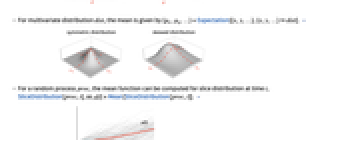
- For multivariate distribution dist, the mean is given by {μx ,μy,…}=Expectation[{x,y,…},{x,y,…}dist]. »
- For a random process proc, the mean function can be computed for slice distribution at time t, SliceDistribution[proc,t], as μ[t]=Mean[SliceDistribution[proc,t]]. »

Examples
open all close allBasic Examples (5)
Scope (22)
Basic Uses (6)
Exact input yields exact output:
Approximate input yields approximate output:
Find the mean of WeightedData:
Find the mean of EventData:
Find the mean of a TimeSeries:
Array Data (5)
Mean for a matrix gives columnwise means:
Mean for a arrays gives columnwise means at the first level:
When the input is an Association, Mean works on its values:
SparseArray data can be used just like dense arrays:
Find mean of a QuantityArray:
Image and Audio Data (2)
Channel-wise mean value of an RGB image:
Mean intensity value of a grayscale image:
On audio objects, Mean works channel-wise:
Date and Time (4)
Distributions and Processes (5)
Find the mean for univariate distributions:
Mean for derived distributions:
Mean for distributions with quantities:
Mean function for a continuous-time random and discrete-state process:
Find the mean of TemporalData at some time t=0.5:
Applications (11)
Basic Applications (5)
The mean represents the center of mass for a distribution:
The mean for distributions without a single mode:
The mean for multivariate distributions:
Mean values of cells in a sequence of steps of 2D cellular automaton evolution:
Compute means for slices of a collection of paths of a random process:
Applications (6)
Find the mean height for the children in a class:
Find the mean height for the children in a class:
Find the mean strength for 480 samples of ceramic material:
Plot a Histogram for the data with mean position highlighted:
Compute the probability that the strength exceeds the mean:
Compute the mean lifetime for a quantity subject to exponential decay with rate ![]() :
:
Smooth an irregularly spaced time series by computing a moving mean:
A vacuum system in a small electron accelerator contains 20 vacuum bulbs arranged in a circle. The vacuum system fails if at least 3 adjacent vacuum bulbs fail:
Properties & Relations (17)
Mean is Total divided by Length:
Mean is equivalent to a 1‐norm divided by Length for positive values:
Mean of WeightedData is equivalent to the mean of the EmpiricalDistribution of the data:
Mean of EventData is equivalent to the mean of the SurvivalDistribution of the data:
For nearly symmetric samples, Mean and Median are nearly the same:
The Mean of absolute deviations from the Mean is MeanDeviation:
Mean is logarithmically related to GeometricMean for positive values:
Mean is the inverse of HarmonicMean of the inverse of the data:
The square root of Mean of the data squared is RootMeanSquare:
The n![]() CentralMoment is the Mean of deviations raised to the n
CentralMoment is the Mean of deviations raised to the n![]() power:
power:
Variance is a scaled Mean of squared deviations from the Mean:
Expectation for a list is a Mean:
MovingAverage is a sequence of means:
A 0% TrimmedMean is the same as Mean:
The Expectation of a random variable in a distribution is the Mean:
LocationTest tests whether the mean is close to 0:
LocationEquivalenceTest tests for equivalence of means in two or more datasets:
Possible Issues (1)
Outliers can have a disproportionate effect on Mean:
Use TrimmedMean to ignore a fraction of the smallest and largest elements:
Use Median as something much less sensitive to outliers:
Neat Examples (1)
The distribution of Mean estimates for 10, 100, and 300 samples:
Text
Wolfram Research (2003), Mean, Wolfram Language function, https://reference.wolfram.com/language/ref/Mean.html (updated 2024).
CMS
Wolfram Language. 2003. "Mean." Wolfram Language & System Documentation Center. Wolfram Research. Last Modified 2024. https://reference.wolfram.com/language/ref/Mean.html.
APA
Wolfram Language. (2003). Mean. Wolfram Language & System Documentation Center. Retrieved from https://reference.wolfram.com/language/ref/Mean.html