


Periodogram
Periodogram[list]
plots the squared magnitude of the discrete Fourier transform (power spectrum) of list.
Periodogram[list,n]
plots the mean of power spectra of non-overlapping partitions of length n.
Periodogram[list,n,d]
uses partitions with offset d.
Periodogram[list,n,d,wfun]
applies a smoothing window wfun to each partition.
Periodogram[list,n,d,wfun,m]
pads partitions with zeros to length m prior to the computation of the transform.
Periodogram[{list1,list2,…},n,d,wfun,m]
plots power spectra of several lists.
Periodogram[audio,…]
plots the power spectrum of audio.
Periodogram[video,…]
plots the power spectrum of the first audio track in video.
Periodogram[{input1,input2,…},…]
plots the power spectra of all inputi.
Details and Options
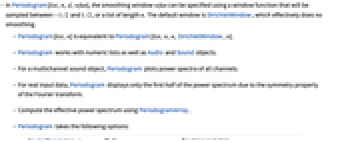
- Periodogram shows the frequency content of a signal by plotting the magnitude squared of the discrete Fourier transform.
- In Periodogram[list,n,d,wfun], the smoothing window wfun can be specified using a window function that will be sampled between
 and
and  , or a list of length n. The default window is DirichletWindow, which effectively does no smoothing.
 - Periodogram[list,n] is equivalent to Periodogram[list,n,n,DirichletWindow,n].
- Periodogram works with numeric lists as well as Audio and Sound objects.
- For a multichannel sound object, Periodogram plots power spectra of all channels.
- For real input data, Periodogram displays only the first half of the power spectrum due to the symmetry property of the Fourier transform.
- Compute the effective power spectrum using PeriodogramArray.
- Periodogram takes the following options:
-
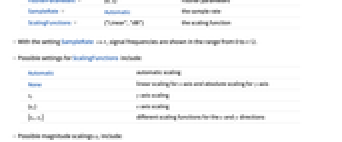
FourierParameters {0,1} Fourier parameters SampleRate Automatic the sample rate ScalingFunctions {"Linear","dB"} the scaling function - With the setting SampleRate->r, signal frequencies are shown in the range from 0 to r/2.
- Possible settings for ScalingFunctions include:
-
Automatic automatic scaling None linear scaling for  axis and absolute scaling for
  axis
axissy  axis scaling
{sx}  axis scaling
 {sx,sy} different scaling functions for the  and
and  directions
 - Possible magnitude scalings sy include:
-
"Absolute" absolute scaling "dB"  decibel scaling (default)
{f,f-1} arbitrary scaling using the function f and its inverse - Possible frequency scalings sx include:
-
"Linear" linear scaling (default) "Log10"  scaling
{f,f-1} arbitrary scaling using the function f and its inverse - The scaling function can be "dB" or "Absolute", which correspond to the decibel and absolute power values, respectively.
- Periodogram also accepts all options of ListLinePlot.
Examples
open all close allBasic Examples (3)
Power spectrum of a noisy dataset:
Periodogram of a Sound object:
Power spectrum of an Audio object:
Scope (4)
Bartlett's method averages over non-overlapping partitions:
Average overlapping partitions:
Welch's method averages over smoothed overlapping partitions:
Pad each partition to increase plot density:
Power spectrum of two dual-tone multi-frequency (DTMF) signals:
Options (33)
AspectRatio (3)
By default, Periodogram uses a fixed height-to-width ratio for the plot:
Make the height the same as the width with AspectRatio1:
AspectRatioFull adjusts the height and width to tightly fit inside other constructs:
Axes (3)
AxesOrigin (2)
AxesStyle (3)
DataRange (1)
FourierParameters (1)
Changing the a parameter in FourierParameters will change the scaling:
ImageSize (7)
Use named sizes such as Tiny, Small, Medium and Large:
Specify the width of the plot:
Specify the height of the plot:
Allow the width and height to be up to a certain size:
Specify the width and height for a graphic, padding with space if necessary:
Setting AspectRatioFull will fill the available space:
Use maximum sizes for the width and height:
Use ImageSizeFull to fill the available space in an object:
Specify the image size as a fraction of the available space:
SampleRate (1)
By default, Periodogram assumes a sampling rate of one sample per time unit:
ScalingFunctions (1)
By default, Periodogram shows the decibel values of magnitude:
Ticks (4)
Properties & Relations (1)
Periodogram plots the magnitude squared of the Fourier transform:
Possible Issues (2)
When an explicit DataRange is specified, the SampleRate setting is ignored:
For very large partitions with a smoothing window, timing is increased due to sampling of the window:
Text
Wolfram Research (2012), Periodogram, Wolfram Language function, https://reference.wolfram.com/language/ref/Periodogram.html (updated 2024).
CMS
Wolfram Language. 2012. "Periodogram." Wolfram Language & System Documentation Center. Wolfram Research. Last Modified 2024. https://reference.wolfram.com/language/ref/Periodogram.html.
APA
Wolfram Language. (2012). Periodogram. Wolfram Language & System Documentation Center. Retrieved from https://reference.wolfram.com/language/ref/Periodogram.html