QuartileDeviation
QuartileDeviation[data]
gives the quartile deviation or semi-interquartile range of the elements in data.
QuartileDeviation[data,{{a,b},{c,d}}]
uses the quantile definition specified by parameters a, b, c, d.
QuartileDeviation[dist]
gives the quartile deviation or semi-interquartile range of the distribution dist.
Details
- QuartileDeviation is a robust measure of dispersion, which means it is not very sensitive to outliers.
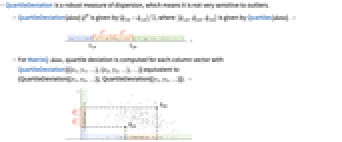
- QuartileDeviation[data]
 is given by
  , where
  is given by Quartiles[data]. »
 - For MatrixQ data, quartile deviation is computed for each column vector with QuartileDeviation[{{x1,y1,…},{x2,y2,…},…}] equivalent to {QuartileDeviation[{x1,x2,…}],QuartileDeviation[{y1,y2,…}]}. »
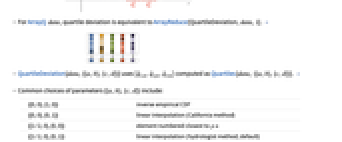
- For ArrayQ data, quartile deviation is equivalent to ArrayReduce[QuartileDeviation,data,1]. »
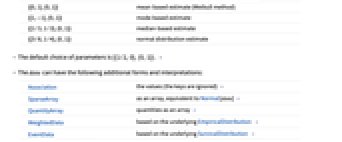
- QuartileDeviation[data,{{a,b},{c,d}}] uses
 computed as Quartiles[data, {{a,b},{c,d}}]. »
 - Common choices of parameters {{a,b},{c,d}} include:
-
{{0,0},{1,0}} inverse empirical CDF {{0,0},{0,1}} linear interpolation (California method) {{1/2,0},{0,0}} element numbered closest to p n {{1/2,0},{0,1}} linear interpolation (hydrologist method; default) {{0,1},{0,1}} mean‐based estimate (Weibull method) {{1,-1},{0,1}} mode‐based estimate {{1/3,1/3},{0,1}} median‐based estimate {{3/8,1/4},{0,1}} normal distribution estimate - The default choice of parameters is {{1/2,0},{0,1}}. »
- The data can have the following additional forms and interpretations:
-
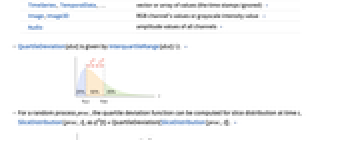
Association the values (the keys are ignored) » SparseArray as an array, equivalent to Normal[data] » QuantityArray quantities as an array » WeightedData based on the underlying EmpiricalDistribution » EventData based on the underlying SurvivalDistribution » TimeSeries, TemporalData, … vector or array of values (the time stamps ignored) » Image,Image3D RGB channel's values or grayscale intensity value » Audio amplitude values of all channels » - QuartileDeviation[dist] is given by InterquartileRange[dist]/2. »
- For a random process proc, the quartile deviation function can be computed for slice distribution at time t, SliceDistribution[proc,t], as
 [t]=QuartileDeviation[SliceDistribution[proc,t]]. »
Examples
open allclose allBasic Examples (2)
Scope (18)
Basic Uses (8)
Exact input yields exact output:
Approximate input yields approximate output:
Compute results using other parametrizations:
Find the quartile deviation for WeightedData:
Find the quartile deviation for EventData:
Find the quartile deviation for TemporalData:
Find the quartile deviation for TimeSeries:
Array Data (5)
QuartileDeviation for a matrix gives columnwise ranges:
Quartile deviation for a tensor works across the first index:
When the input is an Association, QuartileDeviation works on its values:
SparseArray data can be used just like dense arrays:
Find the quartile deviation of a QuantityArray:
Image and Audio Data (2)
Applications (4)
Obtain a robust estimate of dispersion when extreme values are present:
Measures based on the Mean are heavily influenced by extreme values:
Identify periods of high volatility in stock data using a five-year moving quartile deviation:
Compute QuartileDeviation for slices of a collection of paths of a random process:
Plot of the quartile deviations for the selected times:
Find the quartile deviation of the heights for the children in a class:
Properties & Relations (3)
QuartileDeviation is half the difference of linearly interpolated Quantile values:
QuartileDeviation is half the difference between the first and third quartiles:
InterquartileRange is twice QuartileDeviation:
Possible Issues (2)
QuartileDeviation requires numeric values in data:
The symbolic closed form may exist for some distributions:
QuartileDeviation is not the difference between the median and the first or the third quantiles:
The difference between the third and the first quantiles is given by InterquartileRange:
Neat Examples (1)
The distribution of QuartileDeviation estimates for 20, 100 and 300 samples:
Text
Wolfram Research (2007), QuartileDeviation, Wolfram Language function, https://reference.wolfram.com/language/ref/QuartileDeviation.html (updated 2023).
CMS
Wolfram Language. 2007. "QuartileDeviation." Wolfram Language & System Documentation Center. Wolfram Research. Last Modified 2023. https://reference.wolfram.com/language/ref/QuartileDeviation.html.
APA
Wolfram Language. (2007). QuartileDeviation. Wolfram Language & System Documentation Center. Retrieved from https://reference.wolfram.com/language/ref/QuartileDeviation.html