

Raster3D
Raster3D[{{{a11,a12,…},…},…}]
is a three-dimensional graphics primitive that represents a cubical array of gray cells.
Raster3D[{{{{r11,g11,b11},…},…},…}]
represents an array of RGB color cells.
Raster3D[{{{{r11,g11,b11,α11},…},…},…}]
represents an array of color cells with opacity αij.
Raster3D[array,{{xmin,ymin,zmin},{xmax,ymax,zmax}}]
represents a three-dimensional graphics primitive by giving the coordinates of opposite corners.
Raster3D[array,coordinates,{amin,amax}]
represents a three-dimensional graphics primitive whose voxel values should be scaled so that amin corresponds to 0 and amax corresponds to 1.
Details and Options
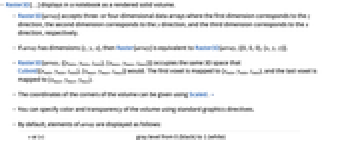
- Raster3D[…] displays in a notebook as a rendered solid volume.
- Raster3D[array] accepts three- or four-dimensional data arrays where the first dimension corresponds to the
 direction, the second dimension corresponds to the
  direction, and the third dimension corresponds to the
  direction, respectively.
 - If array has dimensions {z,y,x}, then Raster[array] is equivalent to Raster3D[array,{{0,0,0},{x,y,z}}].
- Raster3D[array,{{xmin,ymin,zmin},{xmax,ymax,zmax}}] occupies the same 3D space that Cuboid[{xmin,ymin,zmin},{xmax,ymax,zmax}] would. The first voxel is mapped to {xmin,ymin,zmin}, and the last voxel is mapped to {xmax,ymax,ymax}.
- The coordinates of the corners of the volume can be given using Scaled. »
- You can specify color and transparency of the volume using standard graphics directives.
- By default, elements of array are displayed as follows:
-
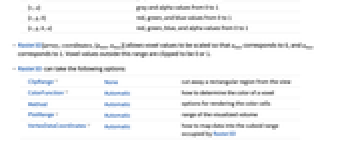
v or {v} gray level from 0 (black) to 1 (white) {v,a} gray and alpha values from 0 to 1 {r,g,b} red, green, and blue values from 0 to 1 {r,g,b,a} red, green, blue, and alpha values from 0 to 1 - Raster3D[array,coordinates,{amin,amax}] allows voxel values to be scaled so that amin corresponds to 0, and amax corresponds to 1. Voxel values outside this range are clipped to be 0 or 1.
- Raster3D can take the following options:
-
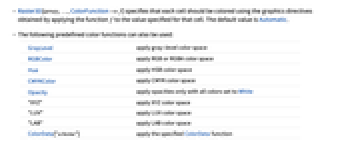
ClipRange None cut away a rectangular region from the view ColorFunction Automatic how to determine the color of a voxel Method Automatic options for rendering the color cells PlotRange Automatic range of the visualized volume VertexDataCoordinates Automatic how to map data into the cuboid range occupied by Raster3D - Raster3D[array,…,ColorFunction->f] specifies that each cell should be colored using the graphics directives obtained by applying the function f to the value specified for that cell. The default value is Automatic.
- The following predefined color functions can also be used:
-
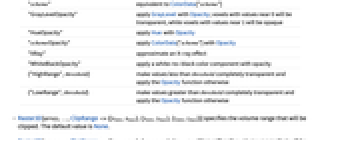
GrayLevel apply gray-level color space RGBColor apply RGB or RGBA color space Hue apply HSB color space CMYKColor apply CMYK color space Opacity apply opacities only with all colors set to White "XYZ" apply XYZ color space "LUV" apply LUV color space "LAB" apply LAB color space ColorData["scheme"] apply the specified ColorData function "scheme" equivalent to ColorData["scheme"] "GrayLevelOpacity" apply GrayLevel with Opacity; voxels with values near 0 will be transparent, while voxels with values near 1 will be opaque "HueOpacity" apply Hue with Opacity "schemeOpacity" apply ColorData["scheme"] with Opacity "XRay" approximate an X-ray effect "WhiteBlackOpacity" apply a white-to-black color component with opacity {"HighRange",threshold} make values less than threshold completely transparent and apply the Opacity function otherwise {"LowRange",threshold} make values greater than threshold completely transparent and apply the Opacity function otherwise - Raster3D[array,…,ClipRange->{{xmin,xmax},{ymin,ymax},{zmin,zmax}}] specifies the volume range that will be clipped. The default value is None.
- Raster3D[array,…,PlotRange->{{xmin,xmax},{ymin,ymax},{zmin,zmax}}] specifies the volume range that will be visualized.
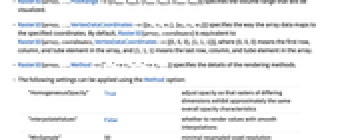
- Raster3D[array,…,VertexDataCoordinates->{{u1,v1,w1},{u2,v2,w2}}] specifies the way the array data maps to the specified coordinates. By default, Raster3D[array,coordinates] is equivalent to Raster3D[array,coordinates,VertexDataCoordinates->{{0,0,0},{1,1,1}}], where {0,0,0} means the first row, column, and tube element in the array, and {1,1,1} means the last row, column, and tube element in the array.
- Raster3D[array,…,Method->{"…"->v1,"…"->v2,…}] specifies the details of the rendering methods.
- The following settings can be applied using the Method option:
-
"HomogeneousOpacity" True adjust opacity so that rasters of differing dimensions exhibit approximately the same overall opacity characteristics "InterpolateValues" False whether to render values with smooth interpolations "MinSample" 50 minimal resampled voxel resolution "SampleLayers" Automatic number of sampling layers to use for the volume "VolumeLighting" False whether the raster should respond to Lighting settings
Examples
open all close allScope (9)
Specification (7)
For a ![]() ×
×![]() ×
×![]() array, the raster occupies the region {0,0,0} to {x,y,z}:
array, the raster occupies the region {0,0,0} to {x,y,z}:
Specify the shape of the Raster3D explicitly:
Use Scaled coordinates:
Scale the resulting values to a nondefault range:
An array of pairs of numbers is treated as gray level with opacity:
An array of triples is treated as an RGBColor specification:
An array of four values is treated as RGBColor with opacity:
Styling (2)
Generalizations & Extensions (1)
Use NumericArray to compress data for better performance of a large dataset:
Options (16)
ClipRange (2)
ColorFunction (5)
A volume with the GrayLevel color function:
The same volume with other color functions:
Opacity variants of color functions allow visualization of volume interiors:
Hue color function:
Apply Hue color function while keeping the opacity:
A 3D image with different color functions:
A customized color function applied to four-dimensional data arrays:
Method Options (7)
"InterpolateValues" (2)
By default, color cells are shown as discrete cells:
Use "InterpolateValues" to smooth color cell drawing:
Set "InterpolateValues"->True for continuous data:
Applications (3)
Properties & Relations (2)
Possible Issues (2)
Text
Wolfram Research (2012), Raster3D, Wolfram Language function, https://reference.wolfram.com/language/ref/Raster3D.html (updated 2019).
CMS
Wolfram Language. 2012. "Raster3D." Wolfram Language & System Documentation Center. Wolfram Research. Last Modified 2019. https://reference.wolfram.com/language/ref/Raster3D.html.
APA
Wolfram Language. (2012). Raster3D. Wolfram Language & System Documentation Center. Retrieved from https://reference.wolfram.com/language/ref/Raster3D.html