Simulation Center—Importing and Exporting
Introduction | Options | Experiment Browser | Plot Windows | 3D Animation | Tools | Measurements | Importing and Exporting | Keyboard Shortcuts | Input Variable Data Files | File Formats | Communication with Simulation
Importing
CSV Files
Simulation Center can load externally produced data in the form of CSV files. To import a CSV file, choose File ▶ Open and select the CSV file. A CSV import dialog will appear that lets you specify the separator used in the file (comma, semicolon, tab, or space) and which column should be interpreted as time. The imported data will appear as a new experiment with the Plot view as the only available view in the Experiment Browser.

The Import CSV File dialog box.
System Modeler Result Files
Simulation Center can open System Modeler result files exported from Simulation Center. To import a System Modeler result file, choose File ▶ Open and select the MAT file. The imported results will appear as a new experiment with the Plot view as the only available view in the Experiment Browser.
Exporting
Result as CSV File
To export the simulation result from the active experiment as a CSV file, choose File ▶ Export ▶ Experiment as CSV. In the file selector window, choose a location and specify a file name. This will save the simulation result as a CSV file.
Result as System Modeler Result File
To export the simulation result from the active experiment as a System Modeler result file, choose File ▶ Export ▶ Experiment as MAT. In the file selector window, choose a location and specify a file name. This will save the simulation result as a System Modeler result file. The file format is described in detail in the appendix on simulation result files.
Simulation Executable
To export the simulation executable and the corresponding settings file from the active experiment, choose File ▶ Export ▶ Simulation executable and select the desired output directory. Two files will be created in that directory: ExperimentName.exe, which is the simulation executable, and ExperimentName.sim, which is the settings file. The settings file contains all parameter values and initial values for the model. The simulation executable takes three switches: -f to specify which settings file to use, -r to specify the result file name, and -server to specify an IP address and a port if the simulation should be run via external application. The communication between the simulation and external applications is described in detail in an appendix. The last two arguments are optional. For example, the following will run MyExperiment.exe using the MyExperiment.sim settings file and the result will be stored in ResultFile.mat.
The following will run MyExperiment.exe using the MyExperiment.sim settings file and listening to IP address 127.0.0.1 and port 7000.
Plot
Plot as Image
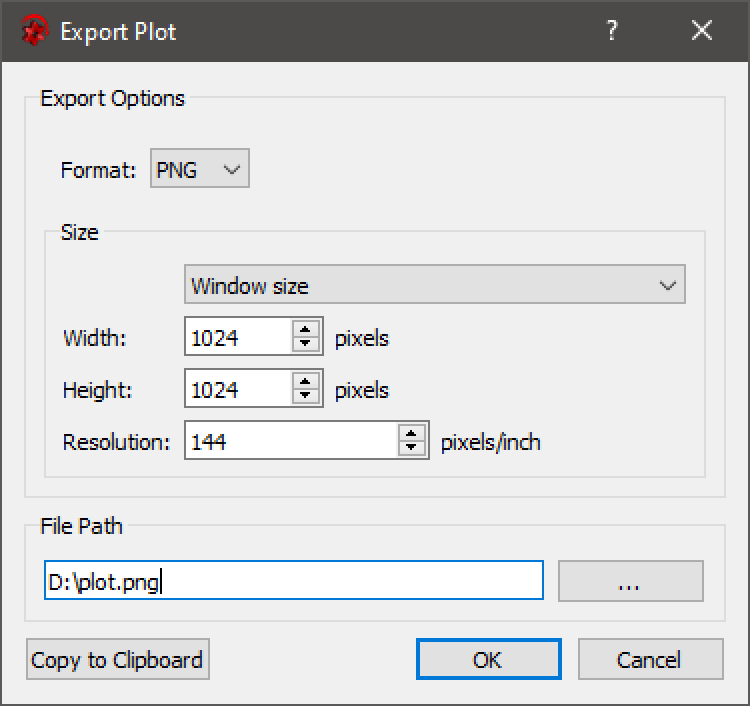
To export the plot in the active plot window as an image file, choose File ▶ Export ▶ Plot as Image.
- Include caption: if enabled and the plot contains a caption, the caption will be included in the image.
Click OK to export the image to the selected location. Alternatively, copy the resulting image to the clipboard by clicking the Copy to Clipboard button.
Plot as CSV file
To export the plot in the active plot window as a CSV file, choose File ▶ Export ▶ Plot as CSV. Note that all subplots in the active window, as well as all variables plotted in each subplot, will be included in the exported CSV file. In the file selector window, choose a location and specify a file name. This will save the plot as a CSV file.
Plot as CombiTimeTable File
To export the plot from the active plot window as a CombiTimeTable file, which is an ASCII text file, choose File ▶ Export ▶ Plot as CombiTimeTable. Note that all subplots in the active window, as well as all variables plotted in each subplot, will be included in the exported text file. In the file selector window, choose a location and specify a file name. This will save the plot data in a .txt file that is compatible for direct use in a CombiTimeTable component. The exported file will have the following structure:
#1
double tab1(5,2) # columns: var1, var2
0.2 55.4
0.4 41.7
0.8 21.2
1.6 11.3
3.2 10.7

double tab2(4, 3) # columns: var3, var4
1.0 0.1 3.2
2.0 22.3 4.4
3.0 31.7 5.0
5.0 34.0 5.2
The table name (tab1, tab2 in the example) is the name of the experiment from which the plot was generated. The comment line specifies which variable each column represents, where the first column is the time variable. A more detailed description of the CombiTimeTable File format can be found here.
To use the data in a CombiTimeTable component, click the component and go to the General tab at the bottom of the main window in Model Center. To set the component to read data from a file, change the parameter tableOnFile to true, and add the name of the relevant table and the file in the fields tableName and fileName, respectively.
Introduction | Options | Experiment Browser | Plot Windows | 3D Animation | Tools | Measurements | Importing and Exporting | Keyboard Shortcuts | Input Variable Data Files | File Formats | Communication with Simulation