|
Chapter 3
Experimental Errors and
Error Analysis
This chapter is largely a tutorial on handling experimental errors of measurement. Much of the material has been extensively tested with science undergraduates at a variety of levels at the University of Toronto.
Whole books can and have been written on this topic but here we distill the topic down to the essentials. Nonetheless, our experience is that for beginners an iterative approach to this material works best. This means that the users first scan the material in this chapter; then try to use the material on their own experiment; then go over the material again; then ...
EDA provides functions to ease the calculations required by propagation of errors, and those functions are introduced in Section 3.3. These error propagation functions are summarized in Section 3.5.
3.1 Introduction
3.1.1 The Purpose of Error Analysis
For students who only attend lectures and read textbooks in the sciences, it is easy to get the incorrect impression that the physical sciences are concerned with manipulating precise and perfect numbers. Lectures and textbooks often contain phrases like:
A particle falling under the influence of gravity is subject to a constant acceleration of 9.8 m/ . If ... . If ...
For an experimental scientist this specification is incomplete. Does it mean that the acceleration is closer to 9.8 than to 9.9 or 9.7? Does it mean that the acceleration is closer to 9.80000 than to 9.80001 or 9.79999? Often the answer depends on the context. If a carpenter says a length is "just 8 inches" that probably means the length is closer to 8 0/16 in. than to 8 1/16 in. or 7 15/16 in. If a machinist says a length is "just 200 millimeters" that probably means it is closer to 200.00 mm than to 200.05 mm or 199.95 mm.
We all know that the acceleration due to gravity varies from place to place on the earth's surface. It also varies with the height above the surface, and gravity meters capable of measuring the variation from the floor to a tabletop are readily available. Further, any physical measure such as g can only be determined by means of an experiment, and since a perfect experimental apparatus does not exist, it is impossible even in principle to ever know g perfectly. Thus, the specification of g given above is useful only as a possible exercise for a student. In order to give it some meaning it must be changed to something like:
A 5 g ball bearing falling under the influence of gravity in Room 126 of McLennan Physical Laboratories of the University of Toronto on March 13, 1995 at a distance of 1.0 ± 0.1 m above the floor was measured to be subject to a constant acceleration of 9.81 ± 0.03 m/ . .
Two questions arise about the measurement. First, is it "accurate," in other words, did the experiment work properly and were all the necessary factors taken into account? The answer to this depends on the skill of the experimenter in identifying and eliminating all systematic errors. These are discussed in Section 3.4.
The second question regards the "precision" of the experiment. In this case the precision of the result is given: the experimenter claims the precision of the result is within 0.03 m/s . The next two sections go into some detail about how the precision of a measurement is determined. However, the following points are important: . The next two sections go into some detail about how the precision of a measurement is determined. However, the following points are important:
1. The person who did the measurement probably had some "gut feeling" for the precision and "hung" an error on the result primarily to communicate this feeling to other people. Common sense should always take precedence over mathematical manipulations.
2. In complicated experiments, error analysis can identify dominant errors and hence provide a guide as to where more effort is needed to improve an experiment.
3. There is virtually no case in the experimental physical sciences where the correct error analysis is to compare the result with a number in some book. A correct experiment is one that is performed correctly, not one that gives a result in agreement with other measurements.
4. The best precision possible for a given experiment is always limited by the apparatus. Polarization measurements in high-energy physics require tens of thousands of person-hours and cost hundreds of thousand of dollars to perform, and a good measurement is within a factor of two. Electrodynamics experiments are considerably cheaper, and often give results to 8 or more significant figures. In both cases, the experimenter must struggle with the equipment to get the most precise and accurate measurement possible.
3.1.2 Different Types of Errors
As mentioned above, there are two types of errors associated with an experimental result: the "precision" and the "accuracy". One well-known text explains the difference this way:
The word "precision" will be related to the random error distribution associated with a particular experiment or even with a particular type of experiment. The word "accuracy" shall be related to the existence of systematic errors—differences between laboratories, for instance. For example, one could perform very precise but inaccurate timing with a high-quality pendulum clock that had the pendulum set at not quite the right length. E.M. Pugh and G.H. Winslow, p. 6.
The object of a good experiment is to minimize both the errors of precision and the errors of accuracy.
Usually, a given experiment has one or the other type of error dominant, and the experimenter devotes the most effort toward reducing that one. For example, in measuring the height of a sample of geraniums to determine an average value, the random variations within the sample of plants are probably going to be much larger than any possible inaccuracy in the ruler being used. Similarly for many experiments in the biological and life sciences, the experimenter worries most about increasing the precision of his/her measurements. Of course, some experiments in the biological and life sciences are dominated by errors of accuracy.
On the other hand, in titrating a sample of HCl acid with NaOH base using a phenolphthalein indicator, the major error in the determination of the original concentration of the acid is likely to be one of the following: (1) the accuracy of the markings on the side of the burette; (2) the transition range of the phenolphthalein indicator; or (3) the skill of the experimenter in splitting the last drop of NaOH. Thus, the accuracy of the determination is likely to be much worse than the precision. This is often the case for experiments in chemistry, but certainly not all.
Question: Most experiments use theoretical formulas, and usually those formulas are approximations. Is the error of approximation one of precision or of accuracy?
3.1.3 References
There is extensive literature on the topics in this chapter. The following lists some well-known introductions.
D.C. Baird, Experimentation: An Introduction to Measurement Theory and Experiment Design (Prentice-Hall, 1962)
E.M. Pugh and G.H. Winslow, The Analysis of Physical Measurements (Addison-Wesley, 1966)
J.R. Taylor, An Introduction to Error Analysis (University Science Books, 1982)
In addition, there is a web document written by the author of EDA that is used to teach this topic to first year Physics undergraduates at the University of Toronto. The following Hyperlink points to that document.
http://www.upscale.utoronto.ca/PVB/Harrison/ErrorAnalysis/
3.2 Determining the Precision
3.2.1 The Standard Deviation
In the nineteenth century, Gauss' assistants were doing astronomical measurements. However, they were never able to exactly repeat their results. Finally, Gauss got angry and stormed into the lab, claiming he would show these people how to do the measurements once and for all. The only problem was that Gauss wasn't able to repeat his measurements exactly either!
After he recovered his composure, Gauss made a histogram of the results of a particular measurement and discovered the famous Gaussian or bell-shaped curve.
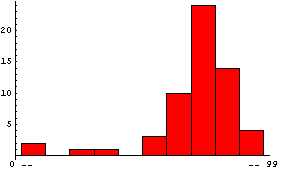
Many people's first introduction to this shape is the grade distribution for a course. Here is a sample of such a distribution, using the EDA function EDAHistogram.
In[1]:=
In[2]:=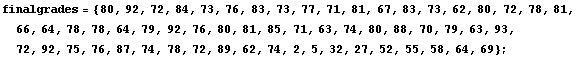
In[3]:=
We use a standard Mathematica package to generate a Probability Distribution Function (PDF) of such a "Gaussian" or "normal" distribution. The mean is chosen to be 78 and the standard deviation is chosen to be 10; both the mean and standard deviation are defined below.
In[4]:=
In[5]:=
Out[5]=
We then normalize the distribution so the maximum value is close to the maximum number in the histogram and plot the result.
In[6]:=
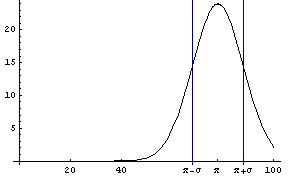
In this graph,  is the mean and is the mean and  is the standard deviation. is the standard deviation.
Finally, we look at the histogram and plot together.
In[7]:=

We can see the functional form of the Gaussian distribution by giving NormalDistribution symbolic values.
In[8]:=
Out[8]=
In this formula, the quantity  is called the mean, and is called the standard deviation. The mean is sometimes called the average. The definition of is as follows. is called the mean, and is called the standard deviation. The mean is sometimes called the average. The definition of is as follows.
Here n is the total number of measurements and x[[i]] is the result of measurement number i.
The standard deviation is a measure of the width of the peak, meaning that a larger value gives a wider peak.
If we look at the area under the curve from  - to - to  + , the area between the vertical bars in the gaussPlot graph, we find that this area is 68 percent of the total area. Thus, any result x[[i]] chosen at random has a 68% change of being within one standard deviation of the mean. We can show this by evaluating the integral. For convenience, we choose the mean to be zero. + , the area between the vertical bars in the gaussPlot graph, we find that this area is 68 percent of the total area. Thus, any result x[[i]] chosen at random has a 68% change of being within one standard deviation of the mean. We can show this by evaluating the integral. For convenience, we choose the mean to be zero.
In[9]:=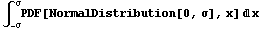
Out[9]=
Now, we numericalize this and multiply by 100 to find the percent.
In[10]:=
Out[10]=
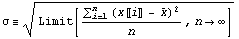
The only problem with the above is that the measurement must be repeated an infinite number of times before the standard deviation can be determined. If n is less than infinity, one can only estimate . For n measurements, this is the best estimate.
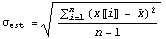
The major difference between this estimate and the definition is the  in the denominator instead of n. This is reasonable since if n = 1 we know we can't determine at all since with only one measurement we have no way of determining how closely a repeated measurement might give the same result. Technically, the quantity in the denominator instead of n. This is reasonable since if n = 1 we know we can't determine at all since with only one measurement we have no way of determining how closely a repeated measurement might give the same result. Technically, the quantity  is the "number of degrees of freedom" of the sample of measurements. is the "number of degrees of freedom" of the sample of measurements.
Here is an example. Suppose we are to determine the diameter of a small cylinder using a micrometer. We repeat the measurement 10 times along various points on the cylinder and get the following results, in centimeters.
In[11]:=
The number of measurements is the length of the list.
In[12]:=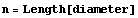
Out[12]=
The average or mean is now calculated.
In[13]:=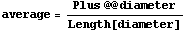
Out[13]=
Then the standard deviation is estimated to be 0.00185173.
In[14]:=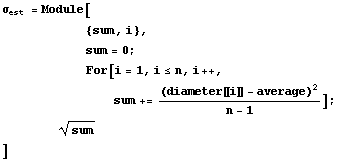
Out[14]=
We repeat the calculation in a functional style.
In[15]:=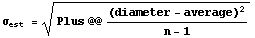
Out[15]=
Note that the Statistics`DescriptiveStatistics` package, which is standard with Mathematica, includes functions to calculate all of these quantities and a great deal more.
We close with two points:
1. The standard deviation has been associated with the error in each individual measurement. Section 3.3.2 discusses how to find the error in the estimate of the average.
2. This calculation of the standard deviation is only an estimate. In fact, we can find the expected error in the estimate,   , (the error in the estimate!). , (the error in the estimate!).
In[16]:=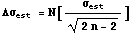
Out[16]=
As discussed in more detail in Section 3.3, this means that the true standard deviation probably lies in the range of values.
In[17]:=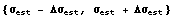
Out[17]=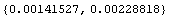
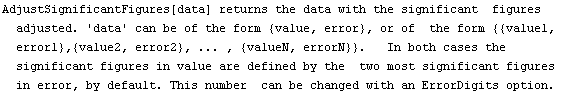
Viewed in this way, it is clear that the last few digits in the numbers above for  or or  have no meaning, and thus are not really significant. An EDA function adjusts these significant figures based on the error. have no meaning, and thus are not really significant. An EDA function adjusts these significant figures based on the error.
In[18]:=
Out[18]=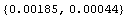
AdjustSignificantFigures is discussed further in Section 3.3.1.
3.2.2 The Reading Error
There is another type of error associated with a directly measured quantity, called the "reading error". Referring again to the example of Section 3.2.1, the measurements of the diameter were performed with a micrometer. The particular micrometer used had scale divisions every 0.001 cm. However, it was possible to estimate the reading of the micrometer between the divisions, and this was done in this example. But, there is a reading error associated with this estimation. For example, the first data point is 1.6515 cm. Could it have been 1.6516 cm instead? How about 1.6519 cm? There is no fixed rule to answer the question: the person doing the measurement must guess how well he or she can read the instrument. A reasonable guess of the reading error of this micrometer might be 0.0002 cm on a good day. If the experimenter were up late the night before, the reading error might be 0.0005 cm.
An important and sometimes difficult question is whether the reading error of an instrument is "distributed randomly". Random reading errors are caused by the finite precision of the experiment. If an experimenter consistently reads the micrometer 1 cm lower than the actual value, then the reading error is not random.
For a digital instrument, the reading error is ± one-half of the last digit. Note that this assumes that the instrument has been properly engineered to round a reading correctly on the display.
3.2.3 "THE" Error
So far, we have found two different errors associated with a directly measured quantity: the standard deviation and the reading error. So, which one is the actual real error of precision in the quantity? The answer is both! However, fortunately it almost always turns out that one will be larger than the other, so the smaller of the two can be ignored.
In the diameter example being used in this section, the estimate of the standard deviation was found to be 0.00185 cm, while the reading error was only 0.0002 cm. Thus, we can use the standard deviation estimate to characterize the error in each measurement. Another way of saying the same thing is that the observed spread of values in this example is not accounted for by the reading error. If the observed spread were more or less accounted for by the reading error, it would not be necessary to estimate the standard deviation, since the reading error would be the error in each measurement.
Of course, everything in this section is related to the precision of the experiment. Discussion of the accuracy of the experiment is in Section 3.4.
3.2.4 Rejection of Measurements
Often when repeating measurements one value appears to be spurious and we would like to throw it out. Also, when taking a series of measurements, sometimes one value appears "out of line". Here we discuss some guidelines on rejection of measurements; further information appears in Chapter 7.
It is important to emphasize that the whole topic of rejection of measurements is awkward. Some scientists feel that the rejection of data is never justified unless there is external evidence that the data in question is incorrect. Other scientists attempt to deal with this topic by using quasi-objective rules such as Chauvenet's Criterion. Still others, often incorrectly, throw out any data that appear to be incorrect. In this section, some principles and guidelines are presented; further information may be found in many references.
First, we note that it is incorrect to expect each and every measurement to overlap within errors. For example, if the error in a particular quantity is characterized by the standard deviation, we only expect 68% of the measurements from a normally distributed population to be within one standard deviation of the mean. Ninety-five percent of the measurements will be within two standard deviations, 99% within three standard deviations, etc., but we never expect 100% of the measurements to overlap within any finite-sized error for a truly Gaussian distribution.
Of course, for most experiments the assumption of a Gaussian distribution is only an approximation.
If the error in each measurement is taken to be the reading error, again we only expect most, not all, of the measurements to overlap within errors. In this case the meaning of "most", however, is vague and depends on the optimism/conservatism of the experimenter who assigned the error.
Thus, it is always dangerous to throw out a measurement. Maybe we are unlucky enough to make a valid measurement that lies ten standard deviations from the population mean. A valid measurement from the tails of the underlying distribution should not be thrown out. It is even more dangerous to throw out a suspect point indicative of an underlying physical process. Very little science would be known today if the experimenter always threw out measurements that didn't match preconceived expectations!
In general, there are two different types of experimental data taken in a laboratory and the question of rejecting measurements is handled in slightly different ways for each. The two types of data are the following:
1. A series of measurements taken with one or more variables changed for each data point. An example is the calibration of a thermocouple, in which the output voltage is measured when the thermocouple is at a number of different temperatures.
2. Repeated measurements of the same physical quantity, with all variables held as constant as experimentally possible. An example is the measurement of the height of a sample of geraniums grown under identical conditions from the same batch of seed stock.
For a series of measurements (case 1), when one of the data points is out of line the natural tendency is to throw it out. But, as already mentioned, this means you are assuming the result you are attempting to measure. As a rule of thumb, unless there is a physical explanation of why the suspect value is spurious and it is no more than three standard deviations away from the expected value, it should probably be kept. Chapter 7 deals further with this case.
For repeated measurements (case 2), the situation is a little different. Say you are measuring the time for a pendulum to undergo 20 oscillations and you repeat the measurement five times. Assume that four of these trials are within 0.1 seconds of each other, but the fifth trial differs from these by 1.4 seconds (i.e., more than three standard deviations away from the mean of the "good" values). There is no known reason why that one measurement differs from all the others. Nonetheless, you may be justified in throwing it out. Say that, unknown to you, just as that measurement was being taken, a gravity wave swept through your region of spacetime. However, if you are trying to measure the period of the pendulum when there are no gravity waves affecting the measurement, then throwing out that one result is reasonable. (Although trying to repeat the measurement to find the existence of gravity waves will certainly be more fun!) So whatever the reason for a suspect value, the rule of thumb is that it may be thrown out provided that fact is well documented and that the measurement is repeated a number of times more to convince the experimenter that he/she is not throwing out an important piece of data indicating a new physical process.
3.3 Propagation of Errors of Precision
3.3.1 Discussion and Examples
Usually, errors of precision are probabilistic. This means that the experimenter is saying that the actual value of some parameter is probably within a specified range. For example, if the half-width of the range equals one standard deviation, then the probability is about 68% that over repeated experimentation the true mean will fall within the range; if the half-width of the range is twice the standard deviation, the probability is 95%, etc.
If we have two variables, say x and y, and want to combine them to form a new variable, we want the error in the combination to preserve this probability.
The correct procedure to do this is to combine errors in quadrature, which is the square root of the sum of the squares. EDA supplies a Quadrature function.
In[1]:=
In[2]:=
Out[2]=
In[3]:=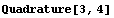
Out[3]=
In[4]:=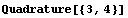
Out[4]=
For simple combinations of data with random errors, the correct procedure can be summarized in three rules. x, y, z will stand for the errors of precision in x, y, and z, respectively. We assume that x and y are independent of each other.
Note that all three rules assume that the error, say x, is small compared to the value of x.
Rule 1: Multiplication and Division
If
z = x * y
or

then
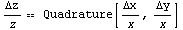
In words, the fractional error in z is the quadrature of the fractional errors in x and y.
Rule 2: Addition and Subtraction
If
z = x + y
or
z = x - y
then
z  Quadrature[x, y] Quadrature[x, y]
In words, the error in z is the quadrature of the errors in x and y.
Rule 3: Raising to a Power
If

then
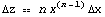
or equivalently

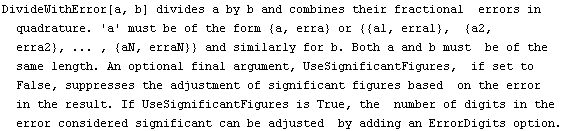
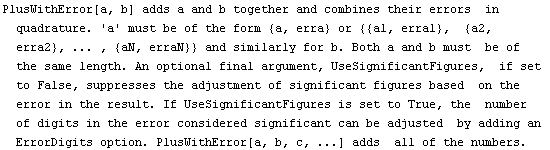
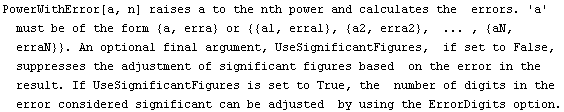
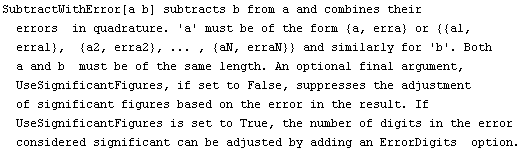
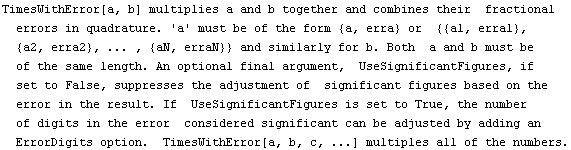
EDA includes functions to combine data using the above rules. They are named TimesWithError, PlusWithError, DivideWithError, SubtractWithError, and PowerWithError.
Imagine we have pressure data, measured in centimeters of Hg, and volume data measured in arbitrary units. Each data point consists of {value, error} pairs.
In[5]:=
In[6]:=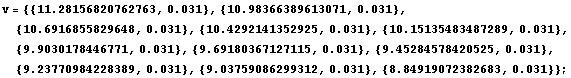
We calculate the pressure times the volume.
In[7]:=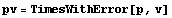
Out[7]=
In the above, the values of p and v have been multiplied and the errors have ben combined using Rule 1.
There is an equivalent form for this calculation.
In[8]:=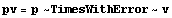
Out[8]=
Consider the first of the volume data: {11.28156820762763, 0.031}. The error means that the true value is claimed by the experimenter to probably lie between 11.25 and 11.31. Thus, all the significant figures presented to the right of 11.28 for that data point really aren't significant. The function AdjustSignificantFigures will adjust the volume data.
In[9]:=
Out[9]=
Notice that by default, AdjustSignificantFigures uses the two most significant digits in the error for adjusting the values. This can be controlled with the ErrorDigits option.
In[10]:=
Out[10]=
For most cases, the default of two digits is reasonable. As discussed in Section 3.2.1, if we assume a normal distribution for the data, then the fractional error in the determination of the standard deviation depends on the number of data points used in its calculation, n, and can be written as follows.

Thus, using this as a general rule of thumb for all errors of precision, the estimate of the error is only good to 10%, (i.e. one significant figure, unless n is greater than 51) . Nonetheless, keeping two significant figures handles cases such as 0.035 vs. 0.030, where some significance may be attached to the final digit.
You should be aware that when a datum is massaged by AdjustSignificantFigures, the extra digits are dropped.
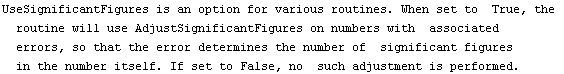
By default, TimesWithError and the other *WithError functions use the AdjustSignificantFigures function. The use of AdjustSignificantFigures is controlled using the UseSignificantFigures option.
In[11]:=
Out[11]=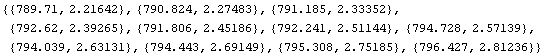
The number of digits can be adjusted.
In[12]:=
Out[12]=
To form a power, say,

we might be tempted to just do
 The reason why this is wrong is that we are assuming that the errors in the two quantities being combined are independent of each other. Here there is only one variable. The correct procedure here is given by Rule 3 as previously discussed, which we rewrite.
 This is implemented in the PowerWithError function.
In[13]:=
Out[13]=
Finally, imagine that for some reason we wish to form a combination.

We might be tempted to solve this with the following.
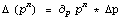
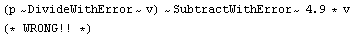 Again, this is wrong because the two terms in the subtraction are not independent. In fact, the general rule is that if
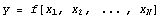
then the error is

Here is an example solving p/v - 4.9v. We shall use x and y below to avoid overwriting the symbols p and v. First we calculate the total derivative.
In[14]:=
Out[14]=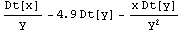
Next we form the error.
In[15]:=
Out[15]=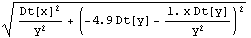
Now we can evaluate using the pressure and volume data to get a list of errors.
In[16]:=
Out[16]=
Next we form the list of {value, error} pairs.
In[17]:=
Out[17]=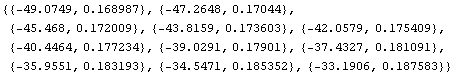
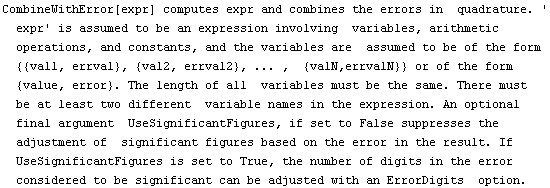
The function CombineWithError combines these steps with default significant figure adjustment.
In[18]:=
Out[18]=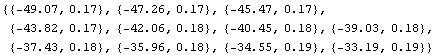
The function can be used in place of the other *WithError functions discussed above.
In[19]:=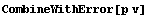
Out[19]=
In this example, the TimesWithError function will be somewhat faster.
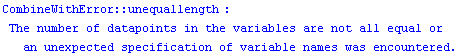
There is a caveat in using CombineWithError. The expression must contain only symbols, numerical constants, and arithmetic operations. Otherwise, the function will be unable to take the derivatives of the expression necessary to calculate the form of the error. The other *WithError functions have no such limitation.
In[20]:=
Out[20]=
In[21]:=
Out[21]=
In[22]:=
In[24]:=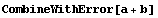
Out[24]=
3.3.1.1 Another Approach to Error Propagation: The Data and Datum Constructs
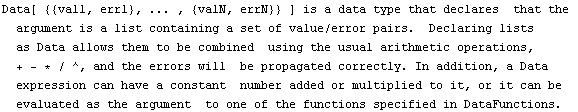
EDA provides another mechanism for error propagation. By declaring lists of {value, error} pairs to be of type Data, propagation of errors is handled automatically.
In[25]:=
Out[25]//OutputForm=Data[{{789.7, 2.2}, {790.8, 2.3}, {791.2, 2.3}, {792.6, 2.4}, {791.8, 2.5},
{792.2, 2.5}, {794.7, 2.6}, {794., 2.6}, {794.4, 2.7}, {795.3, 2.8},
{796.4, 2.8}}]Data[{{789.7, 2.2}, {790.8, 2.3}, {791.2, 2.3}, {792.6, 2.4}, {791.8, 2.5},
{792.2, 2.5}, {794.7, 2.6}, {794., 2.6}, {794.4, 2.7}, {795.3, 2.8},
{796.4, 2.8}}]
The Data wrapper can be removed.
In[26]:=
Out[26]//OutputForm={{789.7, 2.2}, {790.8, 2.3}, {791.2, 2.3}, {792.6, 2.4}, {791.8, 2.5},
{792.2, 2.5}, {794.7, 2.6}, {794., 2.6}, {794.4, 2.7}, {795.3, 2.8}, {796.4, 2.8}}{{789.7, 2.2}, {790.8, 2.3}, {791.2, 2.3}, {792.6, 2.4}, {791.8, 2.5},
{792.2, 2.5}, {794.7, 2.6}, {794., 2.6}, {794.4, 2.7}, {795.3, 2.8}, {796.4, 2.8}}
The reason why the output of the previous two commands has been formatted as OutputForm is that EDA typesets the pairs using ± for StandardForm output.
In[27]:=
Out[27]=
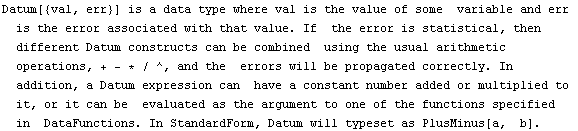
A similar Datum construct can be used with individual data points.
In[28]:=
Out[28]//OutputForm=Datum[{70, 0.04}]Datum[{70, 0.04}]
Just as for Data, the StandardForm typesetting of Datum uses ±.
In[29]:=
Out[29]=
In[30]:=
Out[30]=
In[31]:=
Out[31]=
The Data and Datum constructs provide "automatic" error propagation for multiplication, division, addition, subtraction, and raising to a power. Another advantage of these constructs is that the rules built into EDA know how to combine data with constants.
In[32]:=
Out[32]=
In[33]:=
Out[33]=
The rules also know how to propagate errors for many transcendental functions.
In[34]:=
Out[34]=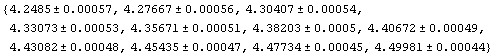
This rule assumes that the error is small relative to the value, so we can approximate.
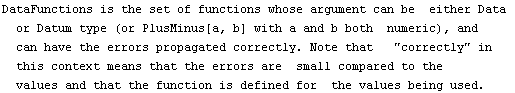
 The transcendental functions, which can accept Data or Datum arguments, are given by DataFunctions.
In[35]:=

In[36]:=
Out[36]=
We have seen that EDA typesets the Data and Datum constructs using ±. The PlusMinus function can be used directly, and provided its arguments are numeric, errors will be propagated.
In[37]:=
Out[37]=
One may typeset the ± into the input expression, and errors will again be propagated.
In[38]:=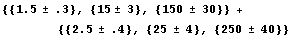
Out[38]=
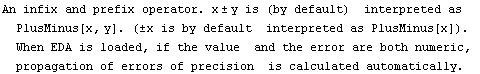
The ± input mechanism can combine terms by addition, subtraction, multiplication, division, raising to a power, addition and multiplication by a constant number, and use of the DataFunctions. The rules used by EDA for ± are only for numeric arguments.
In[39]:=
In[40]:=
Out[40]=
This makes PlusMinus different than Datum.
In[41]:=
Out[41]=
3.3.1.2 Why Quadrature?
Here we justify combining errors in quadrature. Although they are not proofs in the usual pristine mathematical sense, they are correct and can be made rigorous if desired.
First, you may already know about the "Random Walk" problem in which a player starts at the point x = 0 and at each move steps either forward (toward +x) or backward (toward -x). The choice of direction is made randomly for each move by, say, flipping a coin. If each step covers a distance L, then after n steps the expected most probable distance of the player from the origin can be shown to be

Thus, the distance goes up as the square root of the number of steps.
Now consider a situation where n measurements of a quantity x are performed, each with an identical random error x. We find the sum of the measurements.
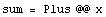 But the sum of the errors is very similar to the random walk: although each error has magnitude x, it is equally likely to be +x as -x, and which is essentially random. Thus, the expected most probable error in the sum goes up as the square root of the number of measurements.
This is exactly the result obtained by combining the errors in quadrature.
Another similar way of thinking about the errors is that in an abstract linear error space, the errors span the space. If the errors are probabilistic and uncorrelated, the errors in fact are linearly independent (orthogonal) and thus form a basis for the space. Thus, we would expect that to add these independent random errors, we would have to use Pythagoras' theorem, which is just combining them in quadrature.
3.3.2 Finding the Error in an Average
The rules for propagation of errors, discussed in Section 3.3.1, allow one to find the error in an average or mean of a number of repeated measurements. Recall that to compute the average, first the sum of all the measurements is found, and the rule for addition of quantities allows the computation of the error in the sum. Next, the sum is divided by the number of measurements, and the rule for division of quantities allows the calculation of the error in the result (i.e., the error of the mean).
In the case that the error in each measurement has the same value, the result of applying these rules for propagation of errors can be summarized as a theorem.
Theorem: If the measurement of a random variable x is repeated n times, and the random variable has standard deviation errx, then the standard deviation in the mean is errx /  . .
Proof: One makes n measurements, each with error errx.
{x1, errx}, {x2, errx}, ... , {xn, errx}
We calculate the sum.
sumx = x1 + x2 + ... + xn
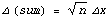
We calculate the error in the sum.

This last line is the key: by repeating the measurements n times, the error in the sum only goes up as Sqrt[n].
The mean  is given by the following. is given by the following.

Applying the rule for division we get the following.
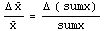 This may be rewritten.
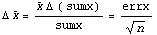
This completes the proof.
The quantity called  is usually called "the standard error of the sample mean" (or the "standard deviation of the sample mean"). The theorem shows that repeating a measurement four times reduces the error by one-half, but to reduce the error by one-quarter the measurement must be repeated 16 times. is usually called "the standard error of the sample mean" (or the "standard deviation of the sample mean"). The theorem shows that repeating a measurement four times reduces the error by one-half, but to reduce the error by one-quarter the measurement must be repeated 16 times.
Here is an example. In Section 3.2.1, 10 measurements of the diameter of a small cylinder were discussed. The mean of the measurements was 1.6514 cm and the standard deviation was 0.00185 cm. Now we can calculate the mean and its error, adjusted for significant figures.
In[42]:=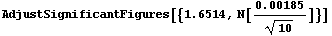
Out[42]=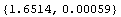
Note that presenting this result without significant figure adjustment makes no sense.
In[43]:=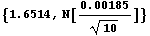
Out[43]=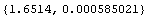
The above number implies that there is meaning in the one-hundred-millionth part of a centimeter.
Here is another example. Imagine you are weighing an object on a "dial balance" in which you turn a dial until the pointer balances, and then read the mass from the marking on the dial. You find m = 26.10 ± 0.01 g. The 0.01 g is the reading error of the balance, and is about as good as you can read that particular piece of equipment. You remove the mass from the balance, put it back on, weigh it again, and get m = 26.10 ± 0.01 g. You get a friend to try it and she gets the same result. You get another friend to weigh the mass and he also gets m = 26.10 ± 0.01 g. So you have four measurements of the mass of the body, each with an identical result. Do you think the theorem applies in this case? If yes, you would quote m = 26.100 ± 0.01/Sqrt[4] = 26.100 ± 0.005 g. How about if you went out on the street and started bringing strangers in to repeat the measurement, each and every one of whom got m = 26.10 ± 0.01 g. So after a few weeks, you have 10,000 identical measurements. Would the error in the mass, as measured on that $50 balance, really be the following?
In[44]:=
Out[44]=
The point is that these rules of statistics are only a rough guide and in a situation like this example where they probably don't apply, don't be afraid to ignore them and use your "uncommon sense". In this example, presenting your result as m = 26.10 ± 0.01 g is probably the reasonable thing to do.
3.4 Calibration, Accuracy, and Systematic Errors
In Section 3.1.2, we made the distinction between errors of precision and accuracy by imagining that we had performed a timing measurement with a very precise pendulum clock, but had set its length wrong, leading to an inaccurate result. Here we discuss these types of errors of accuracy. To get some insight into how such a wrong length can arise, you may wish to try comparing the scales of two rulers made by different companies — discrepancies of 3 mm across 30 cm are common!
If we have access to a ruler we trust (i.e., a "calibration standard"), we can use it to calibrate another ruler. One reasonable way to use the calibration is that if our instrument measures xO and the standard records xS, then we can multiply all readings of our instrument by xS/xO. Since the correction is usually very small, it will practically never affect the error of precision, which is also small. Calibration standards are, almost by definition, too delicate and/or expensive to use for direct measurement.
Here is an example. We are measuring a voltage using an analog Philips multimeter, model PM2400/02. The result is 6.50 V, measured on the 10 V scale, and the reading error is decided on as 0.03 V, which is 0.5%. Repeating the measurement gives identical results. It is calculated by the experimenter that the effect of the voltmeter on the circuit being measured is less than 0.003% and hence negligible. However, the manufacturer of the instrument only claims an accuracy of 3% of full scale (10 V), which here corresponds to 0.3 V.
Now, what this claimed accuracy means is that the manufacturer of the instrument claims to control the tolerances of the components inside the box to the point where the value read on the meter will be within 3% times the scale of the actual value. Furthermore, this is not a random error; a given meter will supposedly always read too high or too low when measurements are repeated on the same scale. Thus, repeating measurements will not reduce this error.
A further problem with this accuracy is that while most good manufacturers (including Philips) tend to be quite conservative and give trustworthy specifications, there are some manufacturers who have the specifications written by the sales department instead of the engineering department. And even Philips cannot take into account that maybe the last person to use the meter dropped it.
Nonetheless, in this case it is probably reasonable to accept the manufacturer's claimed accuracy and take the measured voltage to be 6.5 ± 0.3 V. If you want or need to know the voltage better than that, there are two alternatives: use a better, more expensive voltmeter to take the measurement or calibrate the existing meter.
Using a better voltmeter, of course, gives a better result. Say you used a Fluke 8000A digital multimeter and measured the voltage to be 6.63 V. However, you're still in the same position of having to accept the manufacturer's claimed accuracy, in this case (0.1% of reading + 1 digit) = 0.02 V. To do better than this, you must use an even better voltmeter, which again requires accepting the accuracy of this even better instrument and so on, ad infinitum, until you run out of time, patience, or money.
Say we decide instead to calibrate the Philips meter using the Fluke meter as the calibration standard. Such a procedure is usually justified only if a large number of measurements were performed with the Philips meter. Why spend half an hour calibrating the Philips meter for just one measurement when you could use the Fluke meter directly?
We measure four voltages using both the Philips and the Fluke meter. For the Philips instrument we are not interested in its accuracy, which is why we are calibrating the instrument. So we will use the reading error of the Philips instrument as the error in its measurements and the accuracy of the Fluke instrument as the error in its measurements.
We form lists of the results of the measurements.
In[1]:=
We can examine the differences between the readings either by dividing the Fluke results by the Philips or by subtracting the two values.
In[3]:=
In[4]:=
Out[4]=
In[5]:=
Out[5]=
The second set of numbers is closer to the same value than the first set, so in this case adding a correction to the Philips measurement is perhaps more appropriate than multiplying by a correction.
We form a new data set of format {philips, cor2}.
In[6]:=
Out[6]=
We can guess, then, that for a Philips measurement of 6.50 V the appropriate correction factor is 0.11 ± 0.04 V, where the estimated error is a guess based partly on a fear that the meter's inaccuracy may not be as smooth as the four data points indicate. Thus, the corrected Philips reading can be calculated.
In[7]:=
Out[7]=
(You may wish to know that all the numbers in this example are real data and that when the Philips meter read 6.50 V, the Fluke meter measured the voltage to be 6.63 ± 0.02 V.)
Finally, a further subtlety: Ohm's law states that the resistance R is related to the voltage V and the current I across the resistor according to the following equation.
V = IR
Imagine that we are trying to determine an unknown resistance using this law and are using the Philips meter to measure the voltage. Essentially the resistance is the slope of a graph of voltage versus current.
If the Philips meter is systematically measuring all voltages too big by, say, 2%, that systematic error of accuracy will have no effect on the slope and therefore will have no effect on the determination of the resistance R. So in this case and for this measurement, we may be quite justified in ignoring the inaccuracy of the voltmeter entirely and using the reading error to determine the uncertainty in the determination of R.
3.5 Summary of the Error Propagation Routines
In[1]:=
In[2]:=
In[3]:=
In[4]:=
In[5]:=
In[6]:=
In[7]:=
In[8]:=
In[9]:=
In[10]:=

In[11]:=

In[12]:=
In[13]:=
In[14]:=
In[15]:=
Out[15]=
In[16]:=

In[17]:=

In[18]:=
|