|
3.9.2 FourierPlot

Command structure of FourierPlot.
FourierPlot performs a discrete fourier analysis by applying Fourier on the given functions.
FourierPlot inherits all options from ListPlot. Additionally the following option is available:

Options for FourierPlot.
PlotPoints
The option PlotPoints -> integer specifies the number of sample points. The maximum displayed frequency is given by  . .
See also: Fourier.
Examples
Load Analog Insydes.
In[1]:= <<AnalogInsydes`
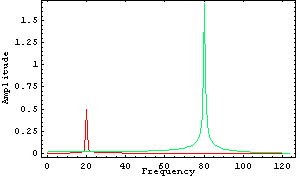
Plot a spectrum of two signals with  and and  . .
In[2]:= FourierPlot[{0.5 Sin[2. Pi 20. t], 2. Cos[2. Pi 80. t]},
{t, 0, 1.}, PlotStyle -> {{Hue[0]}, {Hue[0.4]}}]

Out[2]= 
|