The relative gain array (RGA), R(s), can be useful for establishing the best input-output pairings for use in the control of a multivariable system (Bristol (1966)). The array R(s) is defined as the element-by-element product (the Hadamard or Schur product) of the transfer-function matrix G(s) and the transpose of the inverse of this matrix, G-T(s)=(GT(s))-1=(G-1(s))T. For non-square systems, that is, systems where the number of inputs does not equal the number of outputs, the pseudo-inverse of G(s) is used, in place of the inverse (Glad and Ljung (2000)). Typically, the relative gain array is evaluated at zero frequency, that is,  For square systems, the relative gain array has the unique property that all the elements in a row or column sum to unity. Relative gains in the range 0 to 1 indicate moderate interaction, with values of 0.5 being the worst. To minimize interaction, variables with relative gains closest to 1 should be paired. Variables with negative gains should not be paired for control, and relative gains of greater than 5 usually imply severe loop interaction. The relative gain array of a system can be determined by using the function RelativeGainArray. | RelativeGainArray[system] | calculate the relative gain array for the object system |
Creating the relative gain array. Make sure the application is loaded. Here is a three-input, three-output transfer-function object. | Out[3]= |  |
This is its steady-state relative gain array. | Out[5]= |  |
Here, the best input for the control of output 1 is input 2, the best input for output 2 is input 3, and the best input for output 3 is input 1. So, a precompensator would rearrange the inputs as {2, 3, 1} for outputs {1, 2, 3}, by applying the appropriate permutation matrix to the system inputs. This precompensator implements the permutations. | Out[7]= |  |
Although the relative gain array at zero frequency often gives sensible choices of the inputs and outputs for steady-state control, it disregards the internal dynamics of the system over the bandwidth of interest. A better parameter is often the relative gain array number, which is a frequency-dependent scalar defined as the sum of the absolute values of the elements of the relative gain array minus the identity matrix, that is, where n is the size of the array. The smaller the relative gain array number is, the lower the interaction is in the system at that frequency, the ideal value being zero. The relative gain array number is typically plotted over the frequency range of interest. The function RelativeGainArrayNumberPlot provides such a plot. | RelativeGainArrayNumberPlot[system] |
|
| | generate the relative gain array number plot for the object system |
| RelativeGainArrayNumberPlot[system, {w, wmin, wmax}] |
|
|
| | generate the relative gain array number plot for the object system for frequency w running from wmin to wmax |
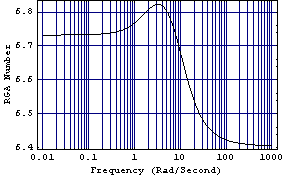
Creating the relative gain array number plots. Following the convention for BodePlot and other frequency-domain plotting functions in Control System Professional, specifying the frequency range is optional. If it is not supplied, RelativeGainArrayNumberPlot tries to determine a suitable range internally. Also optional is the naming of the frequency variable in supplying the desired frequency range; {w, wmin, wmax} works as well as {wmin, wmax}. Here is the relative gain array number plot for the previously considered 3 × 3 transfer-function object. 
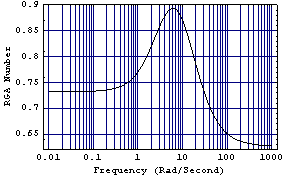
This is the plot for the system with the precompensator determined at zero frequency. Clearly, this compensator also significantly reduces the interaction in the system over the whole frequency range. 
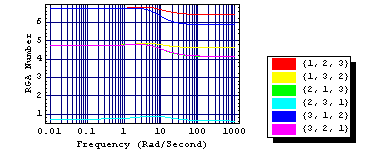
You can also use the function RelativeGainArrayNumberPlot to inspect the relative gain array number for a list of input permutations by using the option InputPermutations. For InputPermutations -> All, the function displays the results for all permutations of the system inputs. If the option InputPermutations is set equal to a list of predetermined possible input arrangements, then the function displays the results for each member set of these input permutations. If, in addition, the option PlotStyle is set to Automatic, the function produces a legend that indicates the color used for each possible input permutation. The default value of the option InputPermutations is None. | option name | default value | | | InputPermutations | None | permutations of the system inputs |
Option specific to RelativeGainArrayNumberPlot. This plots the relative gain array number plots for all possible input permutations. 
Clearly, the relative gain array determined for the input set {2, 3, 1} (light blue) is also the best at all other frequencies of interest. For subsequent controller design, this input permutation should then be applied to the original system transfer-function matrix model to yield a new system with superior loop control configuration. |