

CoordinateBoundsArray[{{xmin,xmax},{ymin,ymax},…}]
生成形如 {x,y,…} 的一组坐标的阵列,在每个维度上的相互间隔都是整数.
CoordinateBoundsArray[{xrange,yrange,…},d]
在每个维度使用步长 d.
CoordinateBoundsArray[{xrange,yrange,…},{dx,dy,…}]
在各个维度分别使用步长 dx, dy, ….
CoordinateBoundsArray[{xrange,yrange,…},Into[n]]
把每个维度划分为 n 个相等的步长.
CoordinateBoundsArray[{xrange,yrange,…},steps,offsets]
指定用于每个坐标点的偏移量.
CoordinateBoundsArray[{xrange,yrange,…},steps,offsets,k]
把阵列在每个方向都扩展 k 个元素.
CoordinateBoundsArray
CoordinateBoundsArray[{{xmin,xmax},{ymin,ymax},…}]
生成形如 {x,y,…} 的一组坐标的阵列,在每个维度上的相互间隔都是整数.
CoordinateBoundsArray[{xrange,yrange,…},d]
在每个维度使用步长 d.
CoordinateBoundsArray[{xrange,yrange,…},{dx,dy,…}]
在各个维度分别使用步长 dx, dy, ….
CoordinateBoundsArray[{xrange,yrange,…},Into[n]]
把每个维度划分为 n 个相等的步长.
CoordinateBoundsArray[{xrange,yrange,…},steps,offsets]
指定用于每个坐标点的偏移量.
CoordinateBoundsArray[{xrange,yrange,…},steps,offsets,k]
把阵列在每个方向都扩展 k 个元素.
更多信息
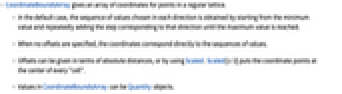
- CoordinateBoundsArray 给出了规则点格中的坐标阵列.
- 在默认情况下,每个方向上的值序列都从最小值开始,在相应的方向重复加上步长直至达到最大值.
- 当没有指定偏移量时,坐标直接对应值序列.
- 偏移量可以以绝对距离的形式给出,或使用 Scaled. Scaled[1/2] 能把坐标点置于每个"晶胞"的中心.
- CoordinateBoundsArray 中的值可以是 Quantity 对象.
范例
打开所有单元 关闭所有单元基本范例 (3)
CoordinateBoundsArray[{{3, 8}, {-1, 2}}]Graphics[Point[Flatten[%, 1]], Frame -> True]CoordinateBoundsArray[{{3, 6}, {-1, 2}, {0, Pi}}, {0.7, 1.5, Pi / 2.}]Graphics3D[Point[Flatten[%, 2]]]bounds = {{3, 8}, {-1, 2}};CoordinateBoundsArray[bounds, 1, Center]Graphics[Point[Flatten[%, 1]], Frame -> True, GridLines -> Range@@@bounds, PlotRange -> bounds]范围 (6)
提供了坐标阵列的角落位置,采用默认的离散化值、偏移量和填充值:
CoordinateBoundsArray[{{3, 8}, {-1, 2}, {0, 2}}]CoordinateBoundsArray[{{3, 9}, {-2, 2}}, 2]CoordinateBoundsArray[{{3, 9}, {-2, 2}}, {2, 0.5}]以 Quantity 对象作为参数:
CoordinateBoundsArray[{Quantity[{3, 9}, "Meters"], Quantity[{-2, 2}, "Seconds"]}, {Quantity[4., "Feet"], Quantity[0.5, "Seconds"]}]Normal[%]bounds = {{6, 16}, {-2, 4}};CoordinateBoundsArray[bounds, 2, Center]Graphics[Point[Flatten[%, 1]], Frame -> True, GridLines -> {Range[6, 16, 2], Range[-2, 4, 2]}, PlotRange -> bounds]CoordinateBoundsArray[bounds, 2, {0.5, 1.8}]Graphics[Point[Flatten[%, 1]], Frame -> True, GridLines -> {Range[6, 16, 2], Range[-2, 4, 2]}, PlotRange -> bounds]用 Scaled 指定相对偏移量:
CoordinateBoundsArray[bounds, 2, {Scaled[0.25], Scaled[0.9]}]bounds = {{3, 8}, {-1, 2}};CoordinateBoundsArray[bounds, 1, Center, {{-1, 3}, {2, 1}}]Graphics[Point[Flatten[%, 1]], Frame -> True, GridLines -> Range@@@bounds, PlotRange -> {{-1, 12}, {-5, 6}}]CoordinateBoundsArray[{{3, 8}, {-1, 2}}, {Into[3], Into[2]}]Most[Dimensions[%]] - 1应用 (1)
bounds = GeoBounds[Entity["Country", "UnitedStates"]]用 CoordinateBoundsArray 生成坐标数组,步长为 2 度:
pos = GeoPosition[CoordinateBoundsArray[bounds, 2]]GeoGraphics[{Point[pos], GeoBoundsRegion[bounds]}, GeoGridLines -> Automatic]Show[%, GeoProjection -> "Mercator"]属性和关系 (4)
CoordinateBounds 返回 0 偏移量的输入边界:
CoordinateBoundsArray[{{3, 8}, {-1, 2}}]CoordinateBounds[%]CoordinateBoundsArray[{{3, 8}, {-1, 2}}, 1, Center]CoordinateBounds[%]CoordinateBoundingBoxArray 使用角落位置代替范围列表:
CoordinateBoundingBoxArray[{{3, -1, 2}, {8, 2, 4}}]% === CoordinateBoundsArray[{{3, 8}, {-1, 2}, {2, 4}}]CoordinateBoundsArray 可以返回坐标列表的阵列,即使在只有一维的情况下:
CoordinateBoundsArray[{{0, 10}}, 2]Range 可以返回那些单独坐标的列表:
Range[0, 10, 2]CoordinateBoundsArray 用 Into 指定分划数目:
CoordinateBoundsArray[{{0, 10}}, Into[5]]Subdivide 可以返回那些单独坐标的列表:
Subdivide[0, 10, 5]文本
Wolfram Research (2015),CoordinateBoundsArray,Wolfram 语言函数,https://reference.wolfram.com/language/ref/CoordinateBoundsArray.html.
CMS
Wolfram 语言. 2015. "CoordinateBoundsArray." Wolfram 语言与系统参考资料中心. Wolfram Research. https://reference.wolfram.com/language/ref/CoordinateBoundsArray.html.
APA
Wolfram 语言. (2015). CoordinateBoundsArray. Wolfram 语言与系统参考资料中心. 追溯自 https://reference.wolfram.com/language/ref/CoordinateBoundsArray.html 年
BibTeX
@misc{reference.wolfram_2026_coordinateboundsarray, author="Wolfram Research", title="{CoordinateBoundsArray}", year="2015", howpublished="\url{https://reference.wolfram.com/language/ref/CoordinateBoundsArray.html}", note=[Accessed: 11-August-2026]}
BibLaTeX
@online{reference.wolfram_2026_coordinateboundsarray, organization={Wolfram Research}, title={CoordinateBoundsArray}, year={2015}, url={https://reference.wolfram.com/language/ref/CoordinateBoundsArray.html}, note=[Accessed: 11-August-2026]}