Simulation Center Tools—Equation Browser
Simulation Center provides a number of tools for working with experiments and simulation results.
For a complete list, see the Tools guide.
Equation Browser
There are several ways to get to the Equation Browser in Simulation Center:
- To open the Equation Browser and go to the equation system that solves a particular variable, right-click the variable in the Plot view of the Experiment Browser and select Show 'variable' in Equation Browser.
- To open the Equation Browser and go to the system or block that generated a particular message in the Simulation Log, click the link at the end of the message.
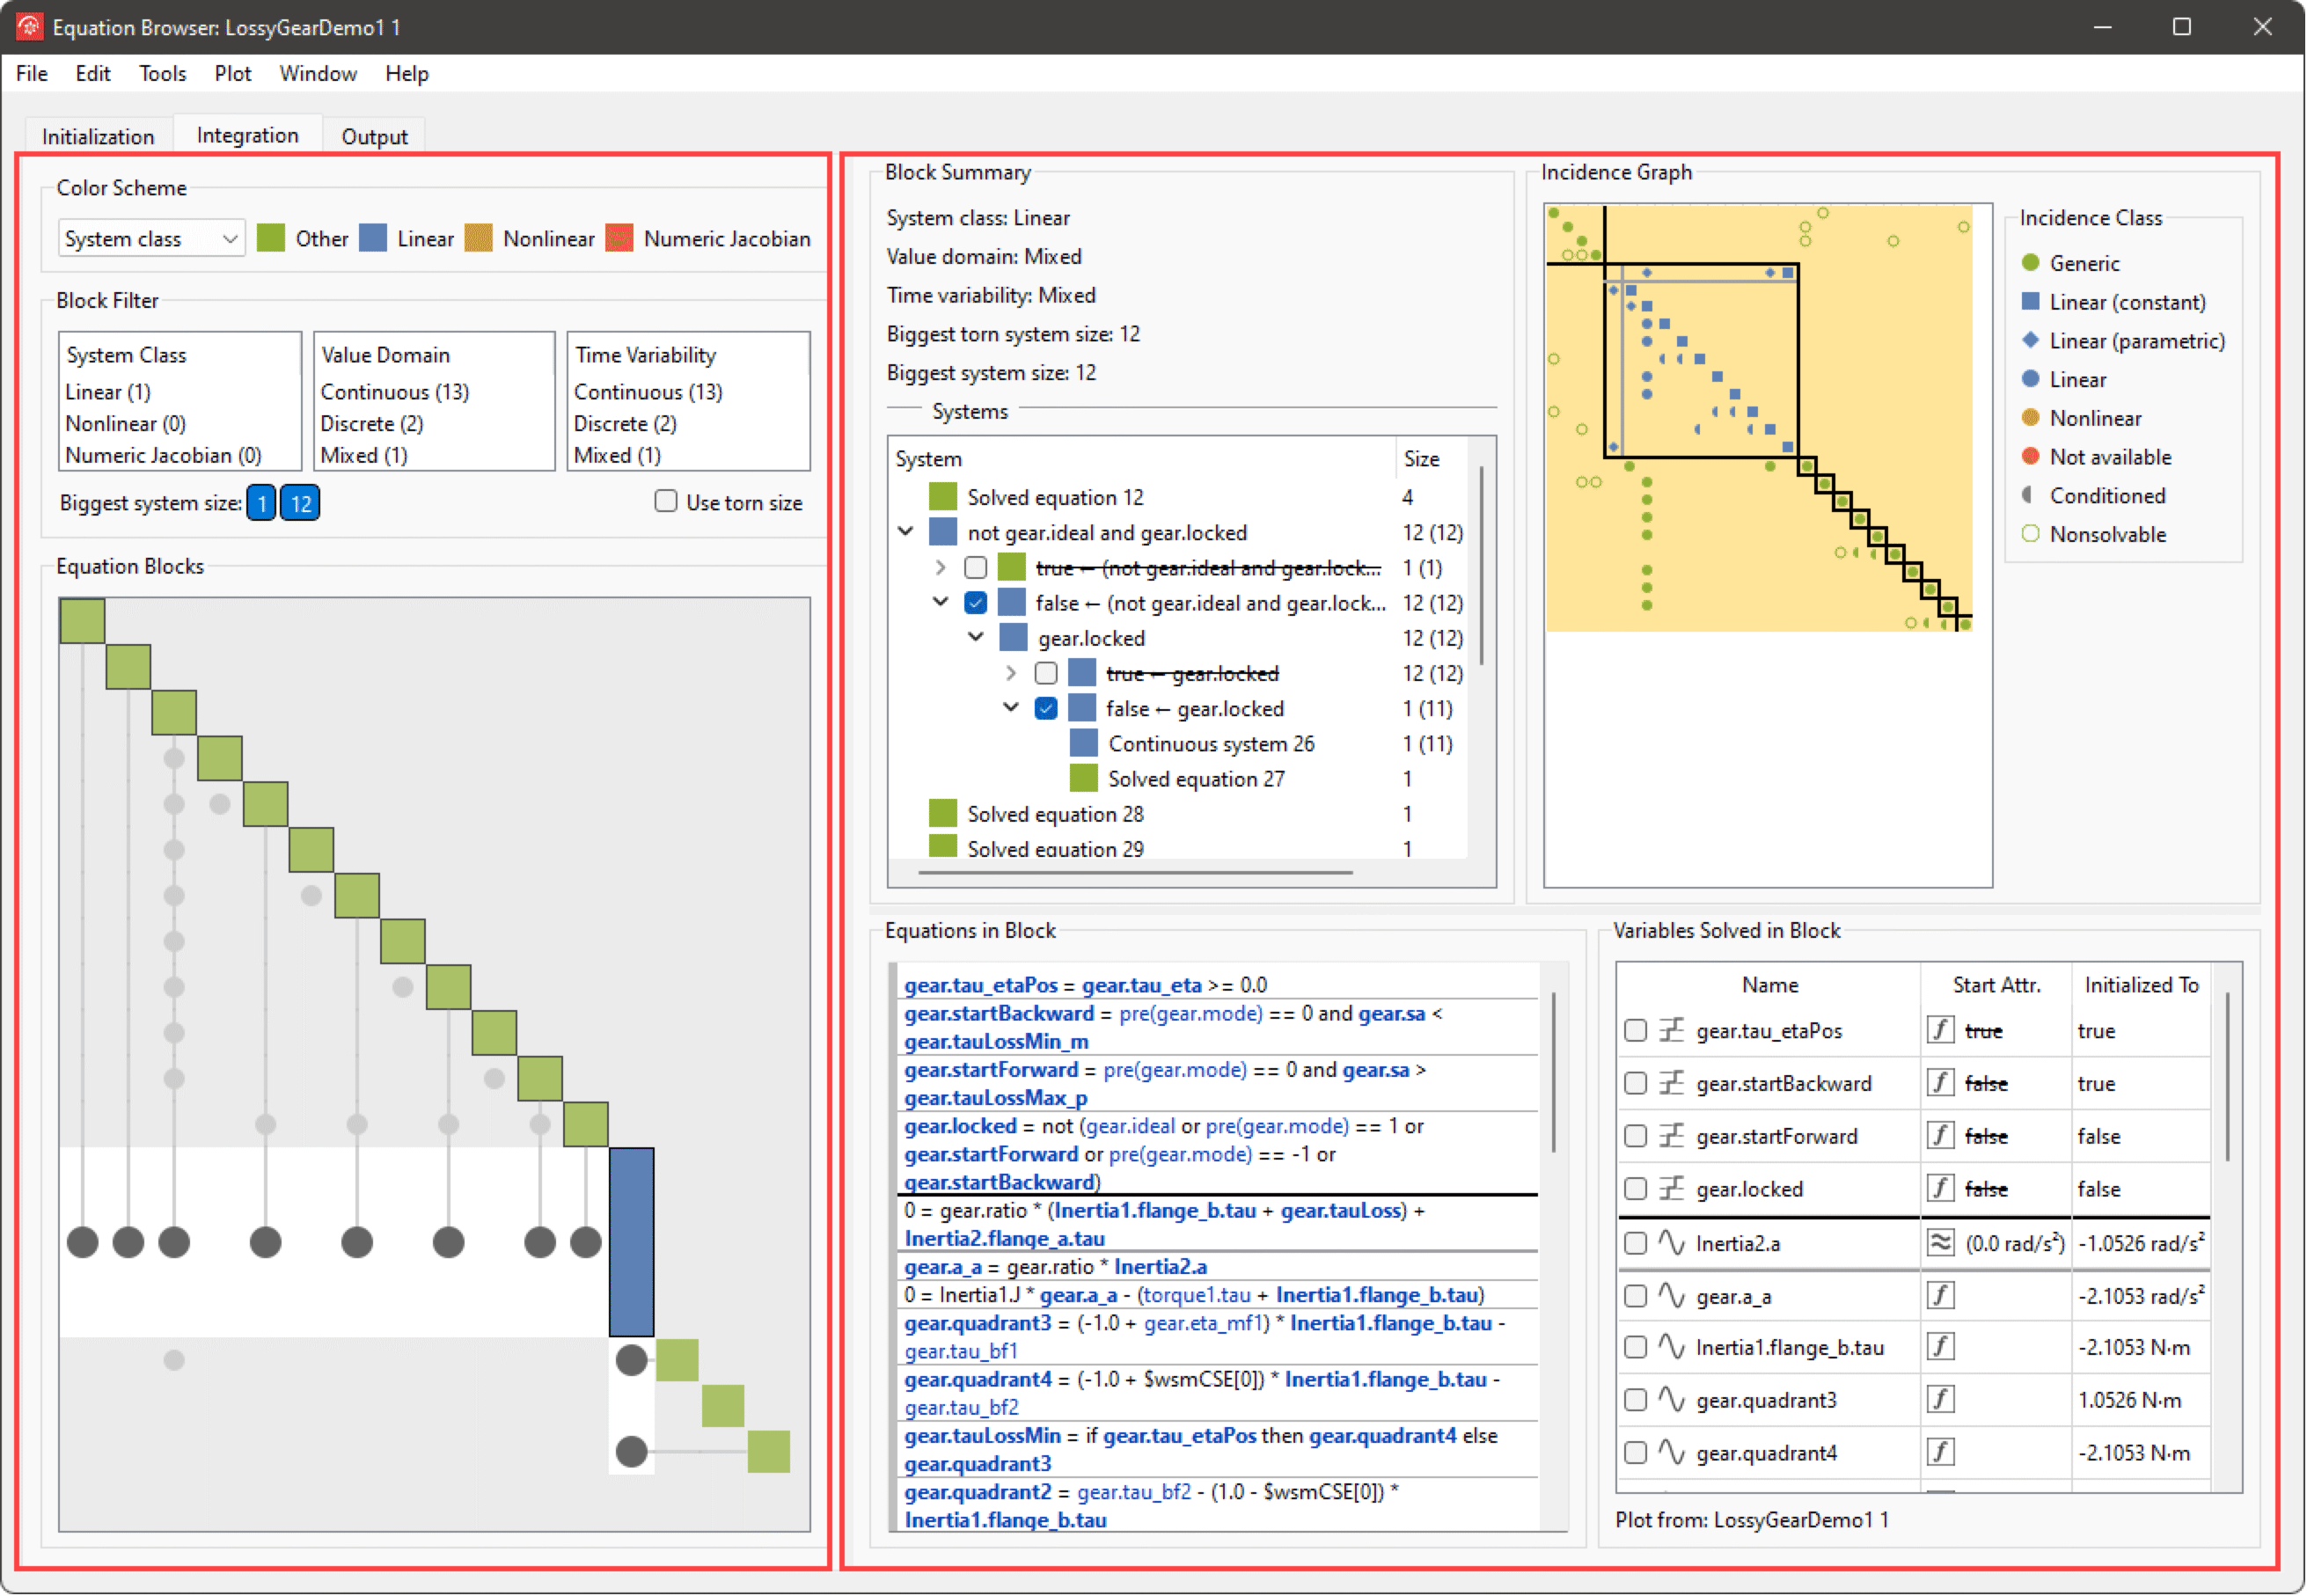
Error message in the Simulation Log with link to the corresponding block or equation system in the Equation Browser.
Overview
The Equation Browser consists of at least three tabs, each corresponding to its part of the simulation problem:
- Integration—the part of the continuous-time partition that needs to be solved by integration in order to advance the time.
- Output—the part of the continuous-time partition that can be calculated from the variables solved in the integration part.
Each tab is divided into two parts, the block browser on the left and the block view showing the currently selected block on the right.
The Equation Browser is divided into two parts, the block browser on the left and the block view to the right.
Equation Blocks and Equation Systems
An appearance of a variable in an equation is called an incidence. In order to identify the block structure shown at the bottom part of the block browser, only basic incidence information is needed (see Incidence Information). This information is collected for all equations and variables, resulting in the bipartite global incidence graph. Then, a (variable-equation) matching is used to turn the bipartite graph into an equation dependency graph, whose strong components are what is called the equation blocks. Sorting the strong components topologically reveals the lower triangular structure seen in the block browser.
Each equation block is associated with the variables matched to the equations in the block.
To solve the equations of a block, the equations and variables are organized into one or more equation systems. Here, varying structure of the equations can be handled, allowing equations to be simplified under various assumptions. This leads to a tree structure with simplifying assumptions in the tree nodes and equation systems in the leaves, and each equation or variable may be part of one or more equation systems.
Classification
Classification in the Equation Browser is found at several levels, and each level is considered in turn in this section, starting with variables and ending at the block level.
Variable Classification
In the Equation Browser, one is only concerned with variables that have values, meaning that external object variables will not be considered. Each remaining scalar variable then belongs to one of three categories, according to its value domain and time variability, with each category having its own symbol:
A discrete-time variable can only change value at events, and a discrete-valued variable can only take on values from a discrete set. A continuous-time variable can change value continuously between events (which is why it cannot be discrete valued) and is allowed to have discontinuous changes. A clocked variable can only change value at clock ticks of its associated clock. The possible combinations correspond directly to Modelica scalar types and variability restrictions:
Incidence Information
Depending on the application, information of different levels of detail may be associated with an incidence.
Basic Incidence Information
The basic incidence information used to identify the block structure consists of a classification as either:
- independent—variable appears in equation, but not in such a way that the equation can be used to solve for the variable.
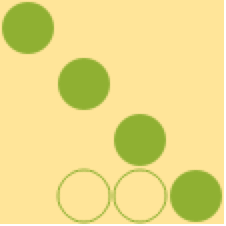
Basic incidence information for the discrete part of a mixed-value block. Dependent incidences are marked with a filled symbol (always a circle in the case of a discrete-valued variable), while independent incidences are marked with an empty circle.
In the Incidence Graph, an independent incidence is shown as an empty circle, whereas a dependent incidence is shown as a filled symbol (not necessarily a circle).
Incidences of discrete-valued variables never get further classification, whereas incidences of continuous-valued variables may be further classified depending on the type of system they appear in.
Enriched Incidence Information
When more detailed incidence classification is needed for a continuous-valued variable, this happens in the context of a system of equations. The partial derivative of the equation's residual with respect to the variable is classified as one of the following, in increasing order of dominance:
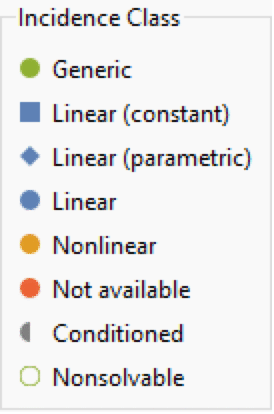
Symbols used to represent incidence information in the Incidence Graph.
This is called the enriched incidence information. In the Incidence Graph, the information is shown using the color and shape (used for linear system incidence variability) of the filled incidence symbols, as explained in the incidence graph's legend. Outside equation systems, the Incidence Graph only shows basic incidence information.
Equation System Classification
An equation system is classified according to the value domain of the variables it solves for:
For an equation system that is solved using the enriched incidence information, the system is also classified according to the most dominant incidence:
The size of an equation system is measured in the total rank of equations, which typically coincides with the number of variables it solves for. When tearing is applied, the torn system size is defined by not counting the equations in the triangular inner system of the tearing partitioning.
Block Classification and Homotopy Structure
Finally, the value domain, time variability and equation system class are propagated from the equation systems of a block to the block as a whole.
For characterization of block size, the size of the biggest equation system is used rather than the total rank of equations in the block.
Above the block structure shown in the block browser, blocks in the initialization problem may also be linked by homotopy initialization. This structure is currently not visible in the Equation Browser.
Block Browser
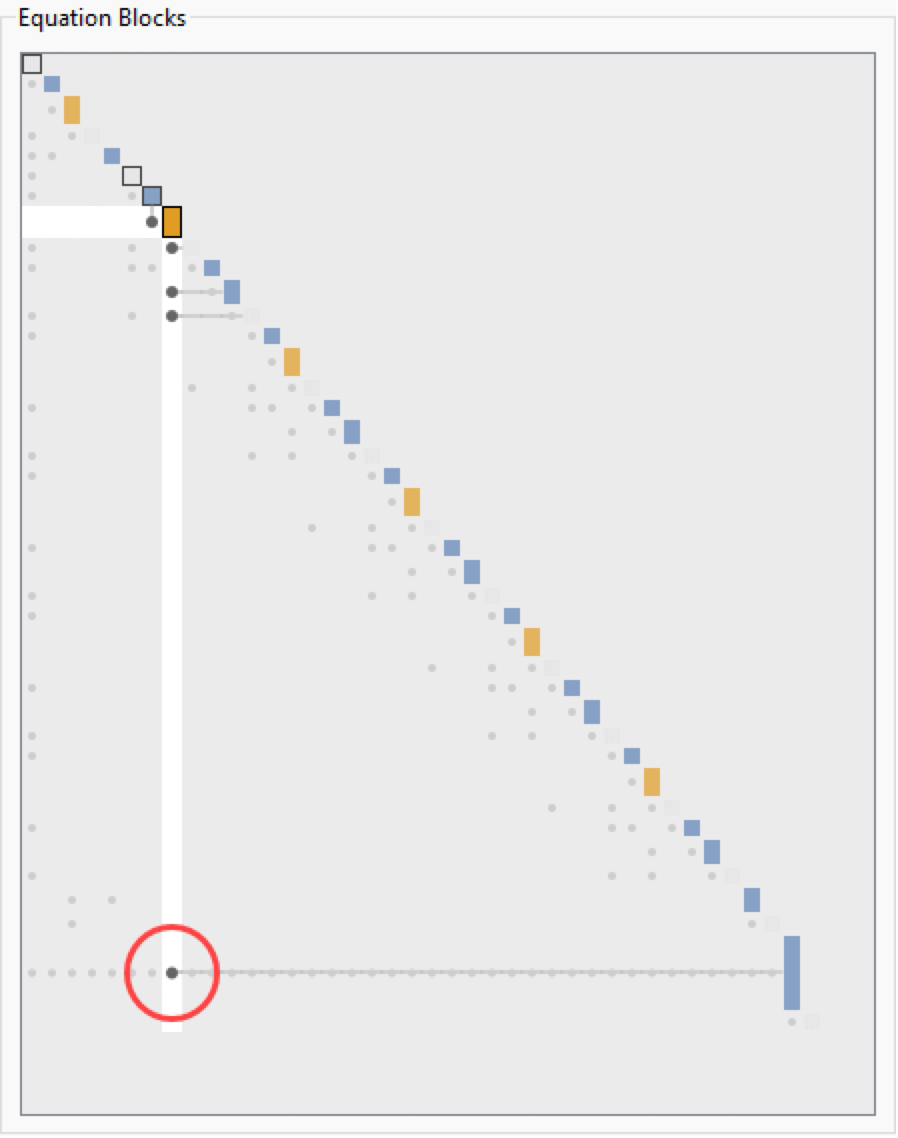
The block browser shows the equation blocks that belong to the selected part of the simulation problem (Initialization/Integration/Output/Clocked Partition N), sorted in the order that they will be solved. The blocks are laid out on the diagonal, and the dependency links between blocks are illustrated with a dot on the left side of the diagonal. If the block at position (i,i) depends on the block at (j,j), there will be a dependency link dot at (i,j). Click the dependency link dot to jump between the dependent block and dependee block. The tooltip for the dependency link will show the variables that are solved by the dependee block and used in the dependent block.
To get more information on a block, select the block by clicking it, and information about that block will be presented in the block view to the right. When a block is selected, all its incoming and outgoing dependency links are highlighted.
The Equation Blocks view with the blocks laid out diagonally and dependency links shown on the left side of the diagonal.
Color Scheme
There is a user-selectable color scheme for each classification axis that can be used to quickly identify objects of a specific class. The selected color scheme is applied throughout the Equation Browser on blocks in the block browser, on systems in Block Summary and on incidences in the Incidence Graph.
Filtering
It is possible to filter blocks by the three classification axes: system class, value domain and time variability. When a filter item is unselected, it shows in parentheses how many blocks there are of that class within the subset selected by the other filter axes. This means that in addition to finding specific blocks, the Block Filter alone can also be used to get global model statistics like:
It is also possible to filter by biggest equation system size in the block. If Use torn size is checked, the biggest equation system size after tearing will be used for filtering. The size buttons have a tooltip that shows how many blocks there are with that biggest equation system size. Sizes that are present in the subset of blocks currently selected by the filter are shown in bold.
Block Filter illustrating that there are three blocks with mixed-value domain and linear equation systems at worst.
Filtered blocks are represented by a small gray block in the Equation Blocks view. To expand a filtered block and undo the effect of filtering on one group of filtered blocks, right-click the block and choose Expand Block. To collapse expanded blocks, right-click anywhere in the Equation Blocks view and choose Collapse Expanded Blocks.
Block View
When a block is selected in the block browser, it is presented in more detail in the block view on the right side of the Equation Browser.
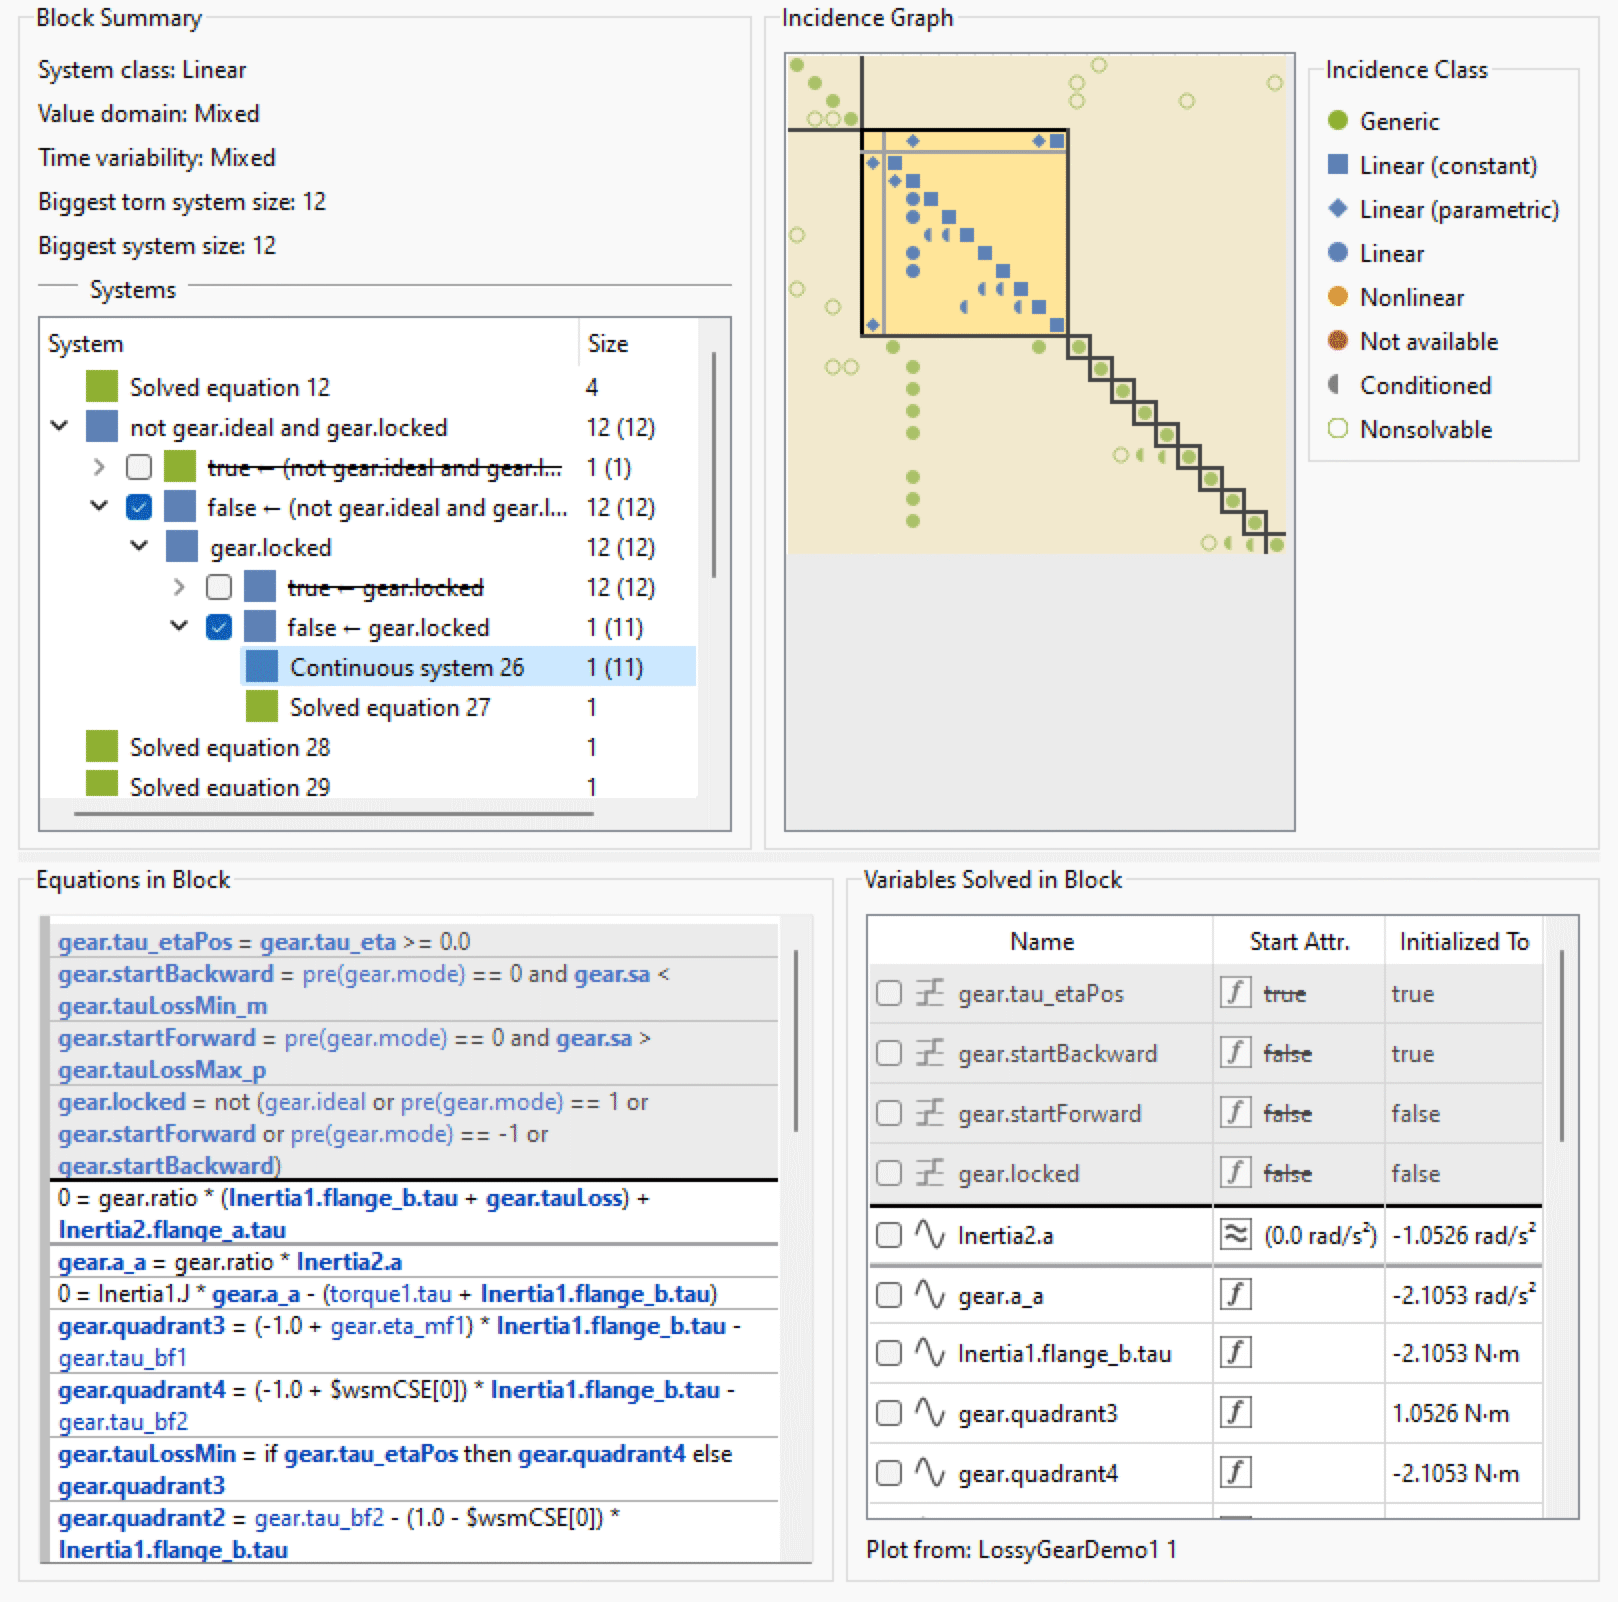
The block view, with a highlighted equation system and an active selection of an incidence and its corresponding equation and variable.
Block Summary
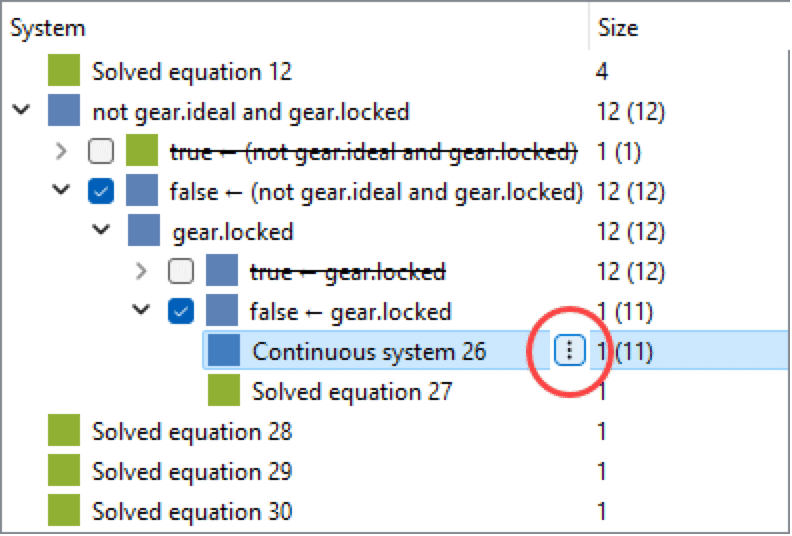
The Block Summary shows the classification of the selected block along the three different classification axes, as well as the biggest equation system size before and after tearing. At the bottom, there is a tree structure with equation systems at the leaves. Checkboxes at the branches of the tree indicate active selections of simplifying assumptions, such as conditions of when-clauses, if-expressions or if-equations. At any time, there is a complete selection of simplifying assumptions, meaning that every selected branching node in the tree has an active selection beneath it. This means that there is always an active set of non-overlapping equation systems. In the active set, one equation system may be highlighted for increased focus on the equations, variables and incidences belonging to the system. Click the action button for system-specific actions like going to the generated code for the system. If Calculate Condition Estimates is enabled, it is also possible to plot the condition estimate for the system if the current block is in the Integration or Output tab. If it is in the Initialization tab, the condition estimate before and after initialization is available as a tooltip on the respective system.
Click the systems action button in the Block Summary for system-specific actions like plotting the condition estimate for the system, or go to the generated code for the system.
Incidence Graph
The Incidence Graph shows the incidence graph for the active selection of equation systems (in the currently selected block), with rows corresponding to the equations listed in Equations in Block, and columns corresponding to variables listed in Variables Solved in Block. When an equation is selected in Equations in Block, the corresponding row is also selected in the Incidence Graph, and when a variable is selected in Variables Solved in Block, the corresponding column is also selected.
The Incidence Graph shows enriched incidence information, as well as a possible partitioning into sub-blocks. Partitioning indicated by gray lines corresponds to equation system tearing. Partitioning indicated by a yellow background corresponds to mixed equation grouping.
Equations in Block
The equations of the currently selected block are listed in Equations in Block. Variables belonging to the selected block are marked in bold. Clicking a variable shown in blue gives a menu with links to related places in the Equation Browser. There is also a contextual menu for the equation, containing links for all variables in the equation.
Variables Solved in Block
The variables solved in the selected block are listed in Variables Solved in Block. A variable that is not available in the simulation result is shown with a disabled look. A variable can be missing due to the current output settings, or because it is an internal help variable that is not stored, or because the model has not been simulated yet.
The Start Value column shows how a variable's start value is used and the actual start value; it's also possible to edit the start value directly here. The start value can be used in three possible ways:
![]() —
initialized exactly from start value.
—
initialized exactly from start value.
![]() —solved using iterative methods;start value is used as initial guess.
—solved using iterative methods;start value is used as initial guess.
![]() —calculated directly from other variables; start value does not have any impact on initialization.
—calculated directly from other variables; start value does not have any impact on initialization.
The Initialized To column shows the actual value after initialization (if simulation result is available for the variable).
Plotting
When the model has been simulated, all variables that are available in the simulation result will have a checkbox next to them. Click the checkbox to plot the variable in the currently active plot. For information on how to create new plot windows or subplots, see Plot Windows.
If there is more than one experiment with a similar variable structure, it is possible to enable automatic plotting from other selected experiments where the variable exists. To set up plotting from other experiments, click the experiment name in the Plot from label and select the experiments to plot from.


