Simulation Center—Experiment Browser
| Pinned and Unpinned Experiments | Sensitivity Analysis |
| Closing Experiments | Plotting Variables and Parameters |
| Duplicating Experiments |
The Experiment Browser is used to browse experiments and to perform operations on the experiments. Each experiment has up to five views for different types of operations:
- Explore: a view from which you can explore model behavior using interactive control panels; see Explore. This view is only visible for experiments with writable models or read-only models that already contain control panels.
- Parameters: a view from which you can edit the parameter values of the experiment; see Setting Parameter and Variable Values.
- Variables: a view from which you can set the initial values for state variables; see Setting Parameter and Variable Values.
- Settings: contains all settings for the experiment; see Experiment Settings.
To change the active view of the Experiment Browser, click the tabs at the top of the browser.
Additionally, there is a Model Plots section for easy plotting access, showing any plots stored in the model that is simulated; see Model Plots for more information.
Pinned and Unpinned Experiments
An experiment can be either pinned or unpinned. The consequence of being unpinned is that when a class is simulated from Model Center, it will search in Simulation Center for the first unpinned experiment for that class and reuse it by rebuilding that experiment. If no unpinned experiment is found for the selected class, a new experiment will be created in the unpinned state.
All experiments created from within Simulation Center will be created in the pinned state.
Closing Experiments
An experiment can be closed by right-clicking its title bar and choosing Close from the popup menu. Choose Close All to close all experiments. Choose Close All But This to close all experiments except the selected one. When closing an experiment, any plotted variables or parameters from that experiment are removed from all plot windows.
Duplicating Experiments
An experiment can be duplicated by right-clicking its title bar and choosing Duplicate from the menu. This will create a new experiment with the same parameter values, initial values, and experiment settings as the original experiment. Note that the model is not rebuilt when duplicating an experiment.
Sensitivity Analysis
When the CVODES solver is used, it is possible to perform forward sensitivity analysis on parameters. To enable sensitivity analysis for a parameter, right-click the parameter in the Parameters view of the Experiment Browser and select Calculate Sensitivity. Alternatively, sensitivity analysis can be configured in Experiment Settings. After a simulation, the result of the sensitivity analysis is available in the Plot view of the Experiment Browser. Now each state variable is expandable, and the sensitivities for that state will be listed as sens(parameter name).

Available sensitivity result for the state inertia1.w in IntroductoryExamples.MultiDomain.DCMotor.
Plotting Variables and Parameters
After an experiment has been simulated, there are two ways to show plots for the simulation. If there are any model plots from the model, they will be shown under the Model Plots at the top of the Experiment Browser; see Model Plots. Below that, the Plot view contains all available variables and parameters of the experiment.
Plot View
In the Plot view, the variables and parameters are presented in a tree view that is built up hierarchically with components as branches. Double-click a component name to expand or collapse its branch. By expanding a branch, you will be able to access the variables and parameters of the corresponding component. Each variable and parameter has a checkbox for selecting that item for plotting. The behavior when selecting a variable for plotting differs depending on the type of the active plot window. There are two different plot windows: the Y(T) plot window, which is used for plotting variables and parameters versus time, and the Y(X) plot window, which is used for plotting a variable or parameter versus another variable or parameter.
Y(T) Plot: Time Plot
If the active window is a Y(T) plot window, see Creating a New Plot Window for information on how to create a new Y(T) plot window. The selected variable is plotted immediately when clicking the corresponding checkbox.
A variable or parameter can be removed from the plot window by clicking its checkbox a second time.
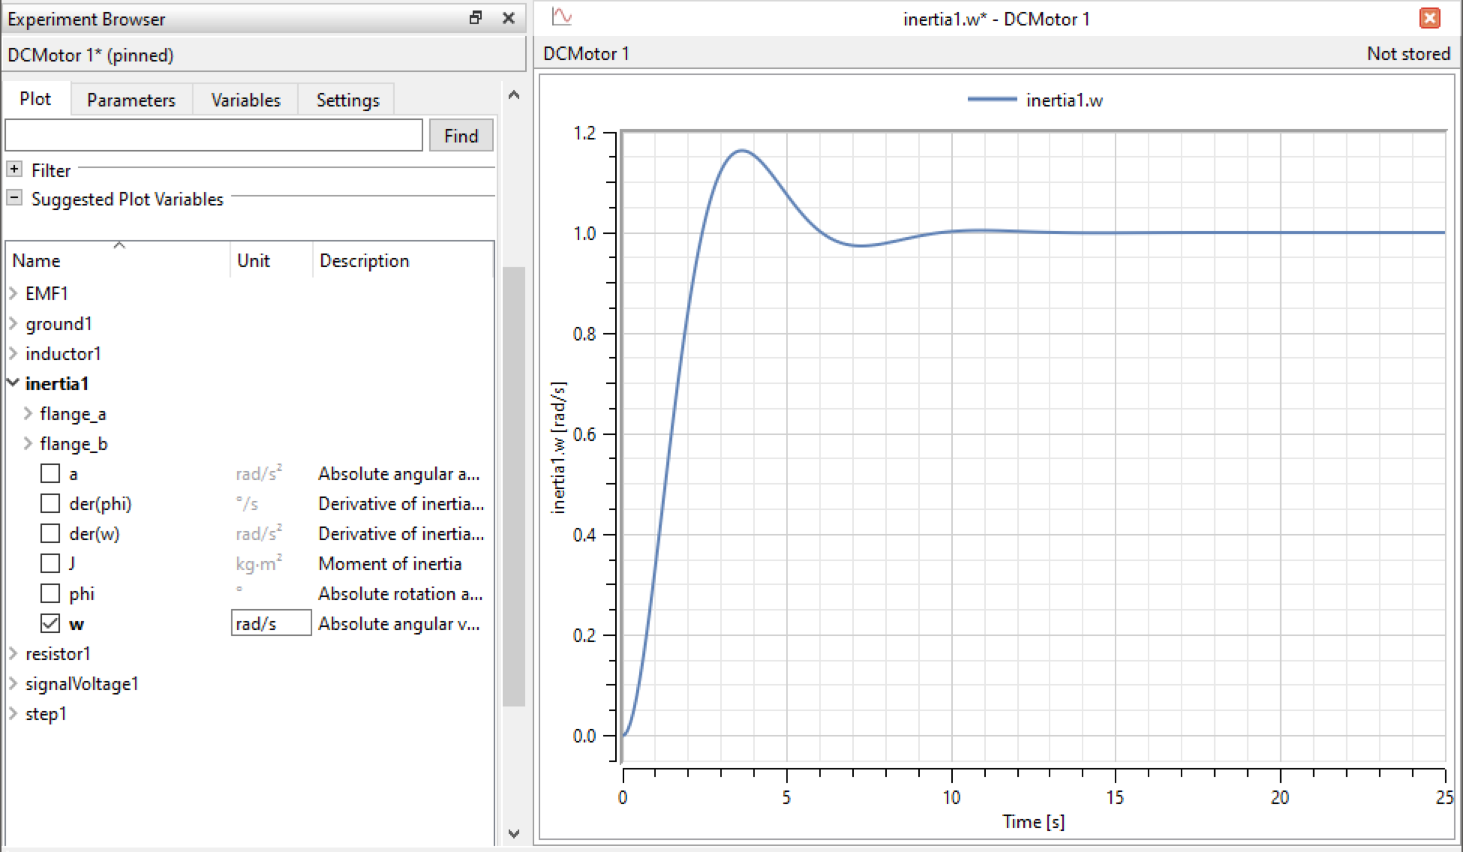
Plotting the inertia1.w variable versus time from IntroductoryExamples.MultiDomain.DCMotor.
Y(X) Plot: Parametric Plot
If the active window is a Y(X) plot window, see Creating a New Plot Window for information on how to create a new Y(X) plot window. The first selected parameter or variable is queued as the ![]() variable for the plot. When the
variable for the plot. When the ![]() variable is selected by clicking on a second variable or parameter, the Y(X) plot is shown in the active plot window. A variable or parameter can be removed from the plot window by clicking its checkbox a second time. When you remove a variable or parameter from a Y(X) plot window, the other variable or parameter in that Y(X) plot will also be removed.
variable is selected by clicking on a second variable or parameter, the Y(X) plot is shown in the active plot window. A variable or parameter can be removed from the plot window by clicking its checkbox a second time. When you remove a variable or parameter from a Y(X) plot window, the other variable or parameter in that Y(X) plot will also be removed.
To plot multiple Y(X) combinations that share a common variable , drag and drop the variables directly onto the plot window: this allows using the same variable multiple times. For example, to create both y1(x) and y2(x) plots, drag x onto the plot window, then drag y1 to complete the first plot. Next, drag x again, followed by y2, to create the second plot.

The chaotic behavior of the Chua circuit (Modelica.Electrical.Analog.Examples.ChuaCircuit) illustrated by the parametric plot of C2.v versus C1.v.
Changing Display Unit
The first plotted variable in a plot window is by default displayed in the displayUnit defined in the model. Subsequent plots of variables with a compatible unit will be converted to the unit of the first plotted variable. To change the unit, click the Unit field of a plotted variable and select the desired unit from the combo box. This will change the plot unit for all variables on the same ![]() axis that can be converted to the selected unit.
axis that can be converted to the selected unit.