WOLFRAM SYSTEM MODELER
Scenario_66th Scenario |
|
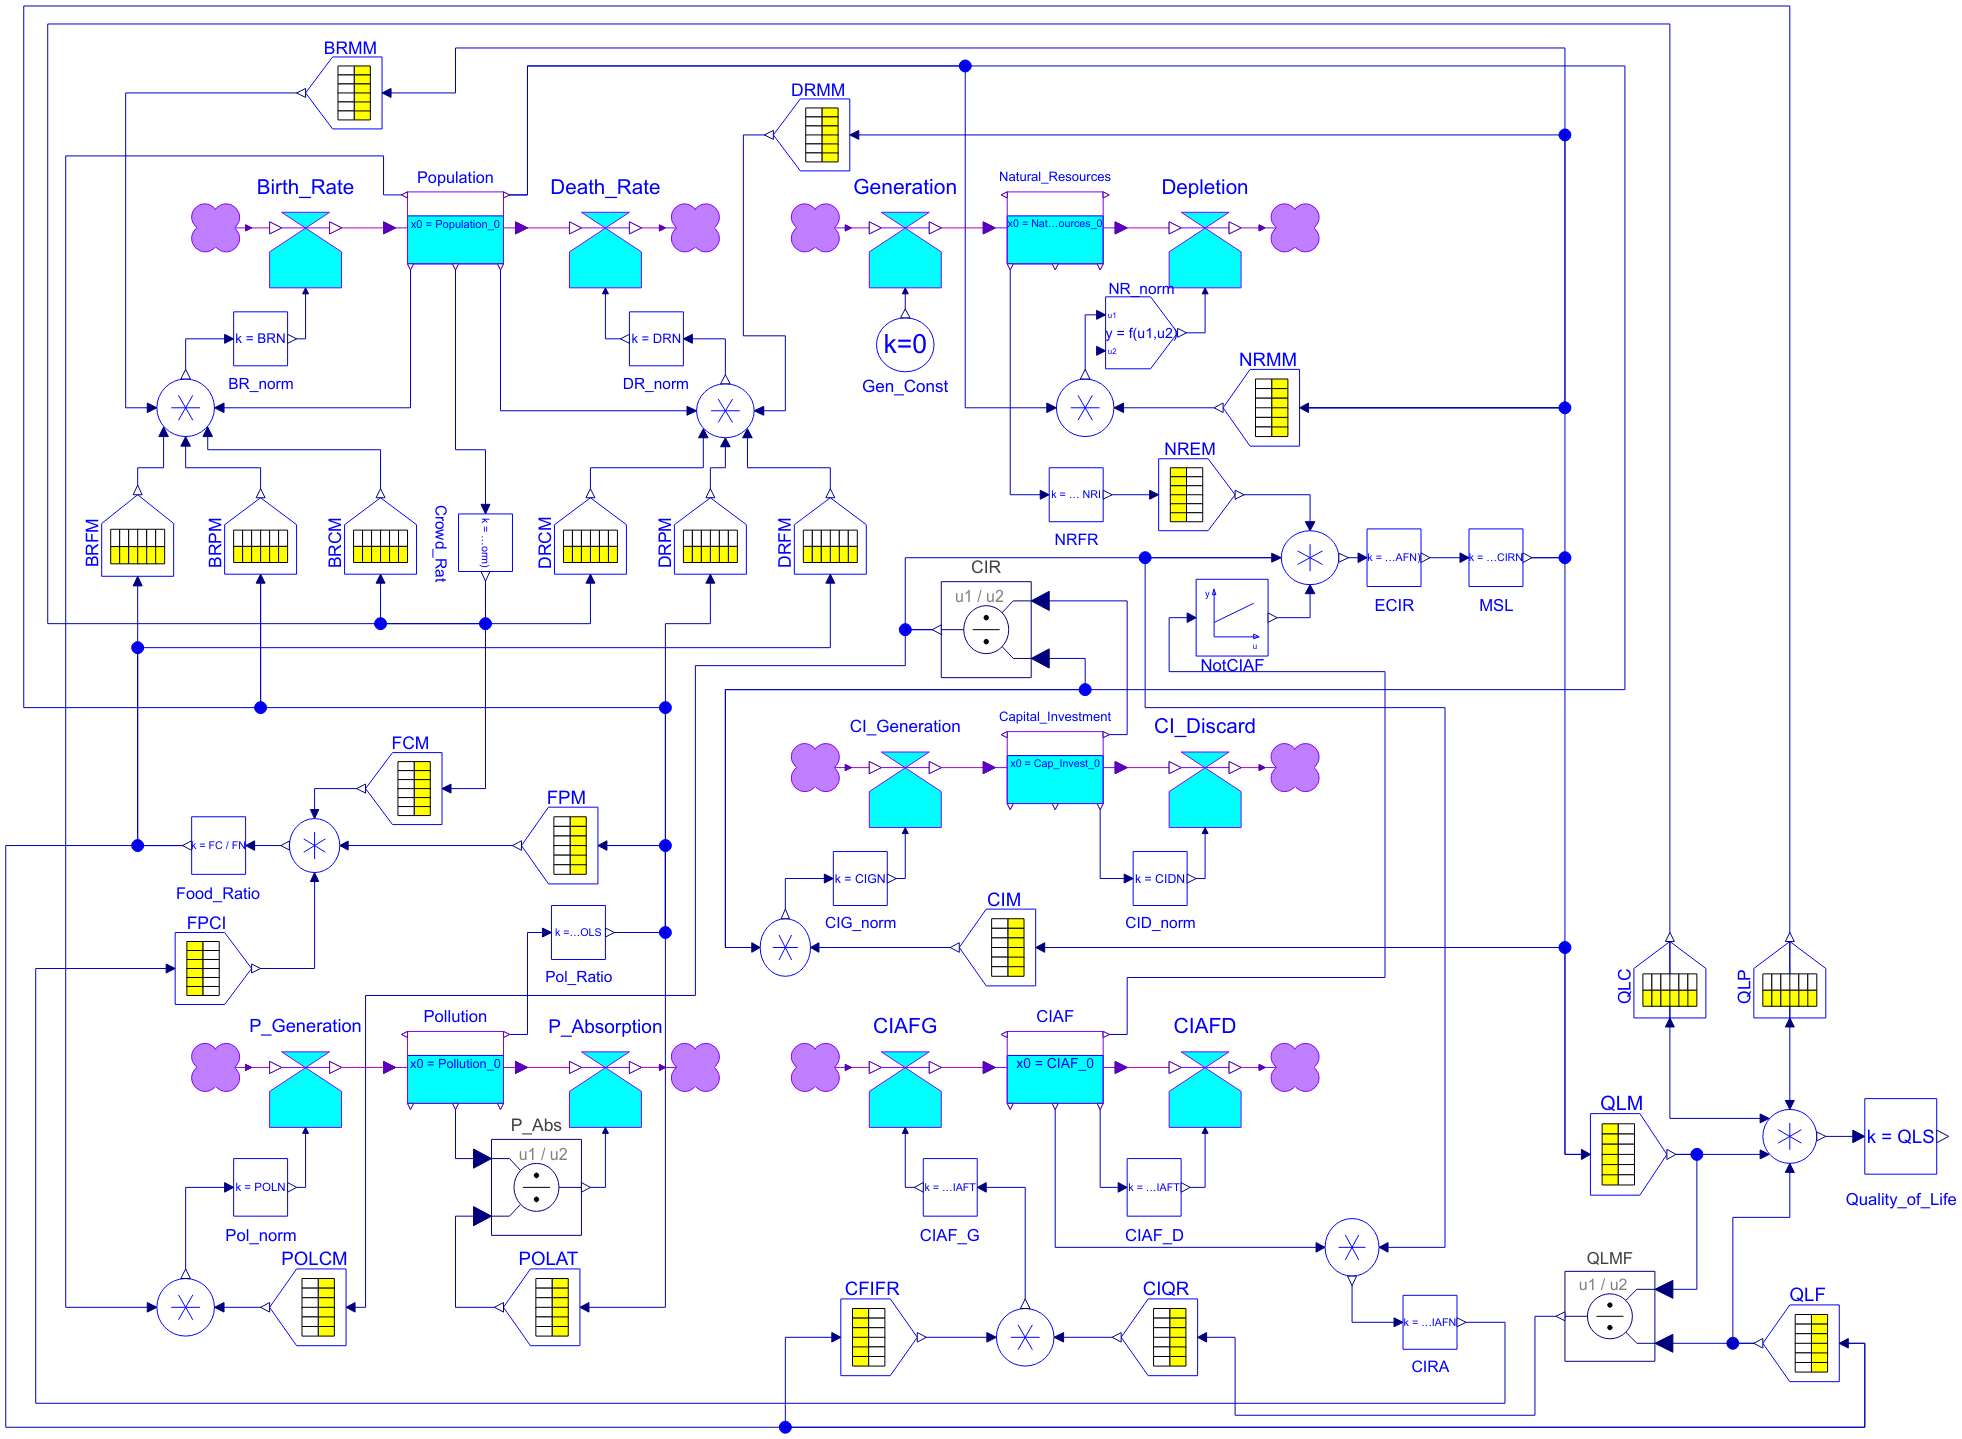
Diagram
Wolfram Language
In[1]:=
SystemModel["SystemDynamics.WorldDynamics.World2.Scenario_6"]
Out[1]:=
Information
The 6th scenario starts out from the 2nd scenario. We now wish to vary the resource utilization rate after the year 1970.
References:
- Cellier, F.E. (1991), Continuous System Modeling, Springer-Verlag, New York, ISBN: 0-387-97502-0, 755p.
- Forrester, J.W. (1971), World Dynamics, Pegasus Communications, 160p.
Simulate the model six times across 200 years while keeping all six trajectories (plot setup menu). For the six simulation runs, choose different levels of resource utilization after the year 1970:
NRUN2 = {0.25, 0.5, 0.75, 1.0, 1.25, 1.5}.
Compute a performance index:
Perf_Index = min_QL + 5*min_dPop;
where min_QL is the minimal quality of life observed between 2000 and 2100, and min_dPop is the largest negative population gradient observed in the same time period.
Plot the performance index across the calendar years between 2000 and 2100 for all six scenarios on a single graph:
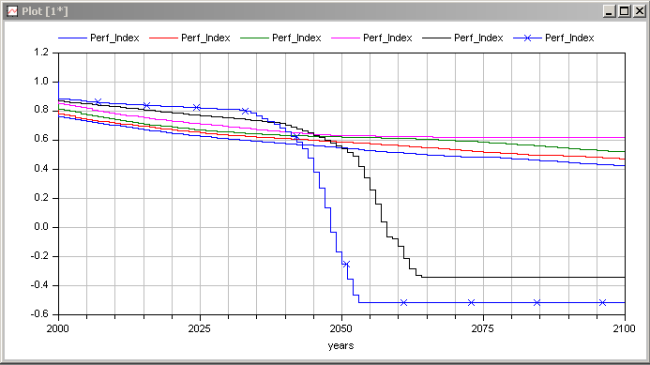
NRUN2 = 0.25 and NRUN2 = 0.5 lead to massive die-off, whereas the other scenarios avoid this problem. However in the short run, those scenarios that offer the worst long-term performance are characterized by the best short-term performance. This is the predicament that humanity is currently facing.
Parameters (21)
| Population_0 |
Value: 1650000000.0 Type: Real Description: World population in 1900 |
|---|---|
| Pollution_0 |
Value: 200000000.0 Type: Real Description: Pollution in 1900 |
| Nat_Resources_0 |
Value: 900000000000.0 Type: Real (ton) Description: Unrecoverable natural resources in 1900 |
| Cap_Invest_0 |
Value: 400000000.0 Type: Real (dollar) Description: Capital investment in 1900 |
| CIAF_0 |
Value: 0.2 Type: Real Description: Proportion of capital investment in agriculture in 1900 |
| BRN |
Value: 0.04 Type: Real (1/yr) Description: Normal birth rate |
| CIAFN |
Value: 0.3 Type: Real (dollar) Description: CIAF normalization |
| CIAFT |
Value: 15.0 Type: Real (yr) Description: CIAF time constant |
| CIDN |
Value: 0.025 Type: Real (dollar/yr) Description: Normal capital discard |
| CIGN |
Value: 0.05 Type: Real (dollar/yr) Description: Normal capital generation |
| DRN |
Value: 0.028 Type: Real (1/yr) Description: Normal death rate |
| ECIRN |
Value: 1.0 Type: Real (dollar) Description: Capital normalization |
| FC |
Value: 1.0 Type: Real (kg/yr) Description: Food coefficient |
| FN |
Value: 1.0 Type: Real (kg/yr) Description: Food normalization |
| Land_Area |
Value: 135000000.0 Type: Real (hectare) Description: Area of arable land |
| NRI |
Value: 900000000000.0 Type: Real (ton) Description: Initial natural resources |
| POLN |
Value: 1.0 Type: Real (1/yr) Description: Normal pollution |
| POLS |
Value: 3599900000.0 Type: Real Description: Standard pollution |
| Pop_dens_norm |
Value: 26.5 Type: Real (1/hectare) Description: Normal population density |
| QLS |
Value: 1.0 Type: Real Description: Standard quality of life |
| NRUN2 |
Value: 1.0 Type: Real (1/yr) Description: Resource utilization after 1970 |
Outputs (6)
| Pop |
Type: Real Description: World population |
|---|---|
| Pol |
Type: Real Description: Pollution |
| Pol_rat |
Type: Real Description: Pollution ratio |
| Cap_inv |
Type: Real (dollar) Description: Capital investment |
| Qual_life |
Type: Real Description: Quality of life |
| Nat_res |
Type: Real (ton) Description: Natural unrecoverable resources |
Components (78)
| Source1 |
Type: Source Description: This is the (dummy) source model of System Dynamics |
|
|---|---|---|
| Birth_Rate |
Type: Rate_1 Description: Unrestricted rate element with one influencing variable |
|
| Population |
Type: Level Description: General System Dynamics level |
|
| Death_Rate |
Type: Rate_1 Description: Unrestricted rate element with one influencing variable |
|
| Sink1 |
Type: Sink Description: This is the (dummy) sink model of System Dynamics |
|
| Source2 |
Type: Source Description: This is the (dummy) source model of System Dynamics |
|
| Generation |
Type: Rate_1 Description: Unrestricted rate element with one influencing variable |
|
| Natural_Resources |
Type: Level Description: General System Dynamics level |
|
| Depletion |
Type: Rate_1 Description: Unrestricted rate element with one influencing variable |
|
| Sink2 |
Type: Sink Description: This is the (dummy) sink model of System Dynamics |
|
| Gen_Const |
Type: Const Description: A constant factor |
|
| BRMM |
Type: Tabular Description: Tabular function |
|
| DRMM |
Type: Tabular Description: Tabular function |
|
| BR_norm |
Type: Gain Description: Gain factor |
|
| Prod_5_1 |
Type: Prod_5 Description: Product of five influencing factors |
|
| DR_norm |
Type: Gain Description: Gain factor |
|
| Prod_5_2 |
Type: Prod_5 Description: Product of five influencing factors |
|
| BRFM |
Type: Tabular Description: Tabular function |
|
| BRPM |
Type: Tabular Description: Tabular function |
|
| BRCM |
Type: Tabular Description: Tabular function |
|
| DRCM |
Type: Tabular Description: Tabular function |
|
| DRPM |
Type: Tabular Description: Tabular function |
|
| DRFM |
Type: Tabular Description: Tabular function |
|
| Crowd_Rat |
Type: Gain Description: Gain factor |
|
| Prod_2_1 |
Type: Prod_2 Description: Product of two influencing factors |
|
| NRMM |
Type: Tabular Description: Tabular function |
|
| Source3 |
Type: Source Description: This is the (dummy) source model of System Dynamics |
|
| CI_Generation |
Type: Rate_1 Description: Unrestricted rate element with one influencing variable |
|
| Capital_Investment |
Type: Level Description: General System Dynamics level |
|
| CI_Discard |
Type: Rate_1 Description: Unrestricted rate element with one influencing variable |
|
| Sink3 |
Type: Sink Description: This is the (dummy) sink model of System Dynamics |
|
| CIG_norm |
Type: Gain Description: Gain factor |
|
| Prod_2_2 |
Type: Prod_2 Description: Product of two influencing factors |
|
| CID_norm |
Type: Gain Description: Gain factor |
|
| CIM |
Type: Tabular Description: Tabular function |
|
| MSL |
Type: Gain Description: Gain factor |
|
| NRFR |
Type: Gain Description: Gain factor |
|
| ECIR |
Type: Gain Description: Gain factor |
|
| Prod_3_1 |
Type: Prod_3 Description: Product of three influencing factors |
|
| NREM |
Type: Tabular Description: Tabular function |
|
| CIR |
Type: Division Description: Output first input divided by second input |
|
| Source4 |
Type: Source Description: This is the (dummy) source model of System Dynamics |
|
| P_Generation |
Type: Rate_1 Description: Unrestricted rate element with one influencing variable |
|
| Pollution |
Type: Level Description: General System Dynamics level |
|
| P_Absorption |
Type: Rate_1 Description: Unrestricted rate element with one influencing variable |
|
| Sink4 |
Type: Sink Description: This is the (dummy) sink model of System Dynamics |
|
| NotCIAF |
Type: Linear Description: Linear function |
|
| Pol_Ratio |
Type: Gain Description: Gain factor |
|
| FCM |
Type: Tabular Description: Tabular function |
|
| Prod_3_2 |
Type: Prod_3 Description: Product of three influencing factors |
|
| Food_Ratio |
Type: Gain Description: Gain factor |
|
| Source5 |
Type: Source Description: This is the (dummy) source model of System Dynamics |
|
| CIAFG |
Type: Rate_1 Description: Unrestricted rate element with one influencing variable |
|
| CIAF |
Type: Level Description: General System Dynamics level |
|
| CIAFD |
Type: Rate_1 Description: Unrestricted rate element with one influencing variable |
|
| Sink5 |
Type: Sink Description: This is the (dummy) sink model of System Dynamics |
|
| CIAF_D |
Type: Gain Description: Gain factor |
|
| CIAF_G |
Type: Gain Description: Gain factor |
|
| Prod_2_3 |
Type: Prod_2 Description: Product of two influencing factors |
|
| P_Abs |
Type: Division Description: Output first input divided by second input |
|
| Pol_norm |
Type: Gain Description: Gain factor |
|
| Prod_2_4 |
Type: Prod_2 Description: Product of two influencing factors |
|
| POLCM |
Type: Tabular Description: Tabular function |
|
| POLAT |
Type: Tabular Description: Tabular function |
|
| CFIFR |
Type: Tabular Description: Tabular function |
|
| FPM |
Type: Tabular Description: Tabular function |
|
| Prod_2_5 |
Type: Prod_2 Description: Product of two influencing factors |
|
| CIRA |
Type: Gain Description: Gain factor |
|
| FPCI |
Type: Tabular Description: Tabular function |
|
| CIQR |
Type: Tabular Description: Tabular function |
|
| QLMF |
Type: Division Description: Output first input divided by second input |
|
| QLM |
Type: Tabular Description: Tabular function |
|
| QLF |
Type: Tabular Description: Tabular function |
|
| Prod_4_1 |
Type: Prod_4 Description: Product of four influencing factors |
|
| QLC |
Type: Tabular Description: Tabular function |
|
| QLP |
Type: Tabular Description: Tabular function |
|
| Quality_of_Life |
Type: Gain Description: Gain factor |
|
| NR_norm |
Type: Parameter_Change Description: Parameter variation of WORLD2 model |