


NumberLinePlot
NumberLinePlot[{v1,v2,…}]
plots the values vi on a number line.
NumberLinePlot[pred,x]
plots a number line illustrating the region pred.
NumberLinePlot[pred,{x,xmin,xmax}]
plots the number to extend over the interval from xmin to xmax.
NumberLinePlot[{spec1,spec2,…},…]
plots several number lines.
Details and Options
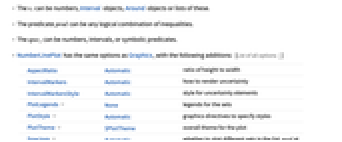
- The vi can be numbers, Interval objects, Around objects or lists of these.
- The predicate pred can be any logical combination of inequalities.
- The speci can be numbers, intervals, or symbolic predicates.
- NumberLinePlot[Tabular[…]cspec] extracts and plots values from the tabular object using the column specification cspec.
- The following forms of column specifications cspec are allowed for plotting tabular data:
-
col plot values from column col {col1,col2,…,coln} plot columns {col1, …, coln} as groups of values - NumberLinePlot has the same options as Graphics, with the following additions: [List of all options]
-
AspectRatio Automatic ratio of height to width IntervalMarkers Automatic how to render uncertainty IntervalMarkersStyle Automatic style for uncertainty elements PlotLegends None legends for the sets PlotStyle Automatic graphics directives to specify styles PlotTheme $PlotTheme overall theme for the plot Spacings Automatic whether to plot different sets in the list pred at different heights - ColorData["DefaultPlotColors"] gives the default sequence of colors used by PlotStyle.
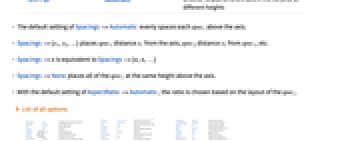
- The default setting of Spacings->Automatic evenly spaces each speci above the axis.
- Spacings->{s1,s2,…} places spec1 distance s1 from the axis, spec2 distance s2 from spec1, etc.
- Spacings->n is equivalent to Spacings->{n,n,…}
- Spacings->None places all of the speci at the same height above the axis.
- With the default setting of AspectRatio->Automatic, the ratio is chosen based on the layout of the speci.
-
 Highlight options with settings specific to NumberLinePlot
-
AlignmentPoint Center the default point in the graphic to align with AspectRatio Automatic ratio of height to width Axes False whether to draw axes AxesLabel None axes labels AxesOrigin Automatic where axes should cross AxesStyle {} style specifications for the axes Background None background color for the plot BaselinePosition Automatic how to align with a surrounding text baseline BaseStyle {} base style specifications for the graphic ContentSelectable Automatic whether to allow contents to be selected CoordinatesToolOptions Automatic detailed behavior of the coordinates tool Epilog {} primitives rendered after the main plot FormatType TraditionalForm the default format type for text Frame False whether to put a frame around the plot FrameLabel None frame labels FrameStyle {} style specifications for the frame FrameTicks Automatic frame ticks FrameTicksStyle {} style specifications for frame ticks GridLines None grid lines to draw GridLinesStyle {} style specifications for grid lines ImageMargins 0. the margins to leave around the graphic ImagePadding All what extra padding to allow for labels etc. ImageSize Automatic the absolute size at which to render the graphic IntervalMarkers Automatic how to render uncertainty IntervalMarkersStyle Automatic style for uncertainty elements LabelStyle {} style specifications for labels Method Automatic details of graphics methods to use PlotLabel None an overall label for the plot PlotLegends None legends for the sets PlotRange All range of values to include PlotRangeClipping False whether to clip at the plot range PlotRangePadding Automatic how much to pad the range of values PlotRegion Automatic the final display region to be filled PlotStyle Automatic graphics directives to specify styles PlotTheme $PlotTheme overall theme for the plot PreserveImageOptions Automatic whether to preserve image options when displaying new versions of the same graphic Prolog {} primitives rendered before the main plot RotateLabel True whether to rotate y labels on the frame Spacings Automatic whether to plot different sets in the list pred at different heights Ticks Automatic axes ticks TicksStyle {} style specifications for axes ticks
List of all options
Examples
open all close allBasic Examples (5)
Scope (9)
Data (7)
Use Interval and single points:
Group intervals and points into a single list to represent a single set:
Use a logical conjunction of equalities and inequalities:
Tabular Data (1)
Options (43)
AspectRatio (4)
By default, the ratio of the height to width for the plot is determined automatically:
Make the height the same as the width with AspectRatio1:
Use numerical value to specify the height-to-width ratio:
AspectRatioFull adjusts the height and width to tightly fit inside other constructs:
AxesStyle (4)
ImageSize (7)
Use named sizes such as Tiny, Small, Medium and Large:
Specify the width of the plot:
Specify the height of the plot:
Allow the width and height to be up to a certain size:
Specify the width and height for a graphic, padding with space if necessary:
Setting AspectRatioFull will fill the available space:
Use maximum sizes for the width and height:
Use ImageSizeFull to fill the available space in an object:
Specify the image size as a fraction of the available space:
PlotLegends (7)
By default, no legends are used:
Create a legend based on the expressions:
Create a legend with placeholder text:
Create a legend with specific labels:
PlotLegends picks up PlotStyle values automatically:
Use Placed to position legends:
Use LineLegend to modify the appearance of the legend:
PlotRange (2)
PlotStyle (3)
PlotTheme (1)
Spacings (4)
Ticks (4)
Applications (6)
Illustrate the domain of a function:
Illustrate the Range of a function:
Visualize the accumulation points of a sequence on the real line:
Show where a function is increasing or decreasing:
Visualize the construction of the Cantor set:
Illustrate the not-so-trivial history of Albert Einstein's citizenship:
Properties & Relations (3)
Use RegionPlot and RegionPlot3D for showing higher-dimensional regions:
Use ListPlot and ListLinePlot to show numbers as a list of heights:
Use RadialAxisPlot and ParallelAxisPlot to display multidimensional points:
Text
Wolfram Research (2014), NumberLinePlot, Wolfram Language function, https://reference.wolfram.com/language/ref/NumberLinePlot.html (updated 2025).
CMS
Wolfram Language. 2014. "NumberLinePlot." Wolfram Language & System Documentation Center. Wolfram Research. Last Modified 2025. https://reference.wolfram.com/language/ref/NumberLinePlot.html.
APA
Wolfram Language. (2014). NumberLinePlot. Wolfram Language & System Documentation Center. Retrieved from https://reference.wolfram.com/language/ref/NumberLinePlot.html