BernoulliGraphDistribution[n,p]
n 個の頂点を持ち辺の確率が p のグラフのベルヌーイ(Bernoulli)グラフ分布を表す.
BernoulliGraphDistribution

BernoulliGraphDistribution[n,p]
n 個の頂点を持ち辺の確率が p のグラフのベルヌーイ(Bernoulli)グラフ分布を表す.
詳細とオプション
- ベルヌーイグラフは n 個の頂点を持つ完全グラフから始め,各辺を別々に確率 p のベルヌーイ試行で選ぶことで構築される.
- 使用可能なオプション
-
DirectedEdges False 有向辺を生成するかどうか - BernoulliGraphDistributionはRandomGraphやGraphPropertyDistribution等の関数で使うことができる.
例題
すべて開く すべて閉じる例 (2)
RandomGraph[BernoulliGraphDistribution[10, 0.6]]𝒟[n_, p_] = GraphPropertyDistribution[EdgeCount[g], gBernoulliGraphDistribution[n, p]]PDF[𝒟[n, p], m]DiscretePlot[Evaluate @ Table[PDF[𝒟[n, 1 / 2], m], {n, 3, 12, 3}], {m, 0, 50}, PlotRange -> All, ExtentSize -> 1 / 2]スコープ (4)
RandomGraph[BernoulliGraphDistribution[5, 0.6]]RandomGraph[BernoulliGraphDistribution[5, 0.6, DirectedEdges -> True]]RandomGraph[BernoulliGraphDistribution[5, 0.8], 4]𝒟 = GraphPropertyDistribution[GlobalClusteringCoefficient[g], gBernoulliGraphDistribution[5, 0.4]];N[Mean[𝒟]]オプション (2)
DirectedEdges (2)
RandomGraph[BernoulliGraphDistribution[10, 0.3]]UndirectedGraphQ[%]DirectedEdges->Trueと設定すると,有向ベルヌーイグラフが生成される:
RandomGraph[BernoulliGraphDistribution[10, 0.3, DirectedEdges -> True]]DirectedGraphQ[%]アプリケーション (3)
20人の幼児が幼稚園で最初の1週間を過ごした後で,2人の幼児が友達になる確率は0.2である:
𝒢 = BernoulliGraphDistribution[20, 0.2];RandomGraph[𝒢]NProbability[x == 1, xGraphPropertyDistribution[Boole[ConnectedGraphQ[g]], g𝒢]]15人が参加し各人が互いに雪玉を投げ合う雪合戦で,指定された参加者の雪玉に当る確率は0.4である:
𝒢 = BernoulliGraphDistribution[15, 0.4, DirectedEdges -> True];RandomGraph[𝒢]Length[First[FindClique[%]]]𝒟[n_, β_] := GraphPropertyDistribution[Length[First[ConnectedComponents[g]]] / n, gBernoulliGraphDistribution[n, β / (n - 1)]]Table[RandomVariate[𝒟[10, β]], {β, 0, 3}]100回実行した平均を求め,それを異なる頂点数でプロットする:
Table[Plot[Mean[RandomVariate[𝒟[10, β], 100]], {β, 0, 3}, MaxRecursion -> 2, PlotLabel -> n], {n, {10, 100}}]特性と関係 (6)
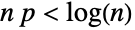
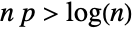
GraphPropertyDistribution[VertexCount[g], gBernoulliGraphDistribution[n, p]]𝒟[n_, p_] = GraphPropertyDistribution[EdgeCount[g], gBernoulliGraphDistribution[n, p]]PDF[𝒟[n, p], m]DiscretePlot[Evaluate @ Table[PDF[𝒟[n, 0.4], x], {n, 3, 12, 3}], {x, 0, 40}, PlotRange -> All, ExtentSize -> 1 / 2]Mean[𝒟[n, p]]𝒟[n_, p_] = GraphPropertyDistribution[VertexDegree[g, v], gBernoulliGraphDistribution[n, p]]PDF[𝒟[n, p], k]DiscretePlot[Evaluate @ Table[PDF[𝒟[n, 0.3], x], {n, 5, 50, 15}], {x, 0, 25}, PlotRange -> All, ExtentSize -> 1 / 2]Mean[𝒟[n, p]]𝒟[n_, p_] := GraphPropertyDistribution[Boole[ConnectedGraphQ[g]], gBernoulliGraphDistribution[n, p]]ベルヌーイグラフは
の区間ではほとんど絶対に連結していない:
NProbability[x == 0, x𝒟[500, 0.01], Method -> {"MonteCarlo", PrecisionGoal -> 1}]NProbability[x == 1, x𝒟[500, 0.02], Method -> {"MonteCarlo", PrecisionGoal -> 1}]BernoulliDistributionを使ってBernoulliGraphDistributionのシミュレーションを行う:
bernoulli[n_, p_] :=
Graph[Range[n], Pick[EdgeList[CompleteGraph[n]],
RandomVariate[BernoulliDistribution[p], n(n - 1) / 2], 1]]Table[bernoulli[10, p], {p, 0.3, 1, 0.2}]辺確率1の場合はCompleteGraphになる:
RandomGraph[BernoulliGraphDistribution[5, 1]]CompleteGraphQ[%]RandomGraph[BernoulliGraphDistribution[5, 0]]EmptyGraphQ[%]関連するガイド
-
▪
- ランダムグラフ ▪
- ソーシャルネットワーク分析 ▪
- 派生統計分布
テキスト
Wolfram Research (2010), BernoulliGraphDistribution, Wolfram言語関数, https://reference.wolfram.com/language/ref/BernoulliGraphDistribution.html.
CMS
Wolfram Language. 2010. "BernoulliGraphDistribution." Wolfram Language & System Documentation Center. Wolfram Research. https://reference.wolfram.com/language/ref/BernoulliGraphDistribution.html.
APA
Wolfram Language. (2010). BernoulliGraphDistribution. Wolfram Language & System Documentation Center. Retrieved from https://reference.wolfram.com/language/ref/BernoulliGraphDistribution.html
BibTeX
@misc{reference.wolfram_2026_bernoulligraphdistribution, author="Wolfram Research", title="{BernoulliGraphDistribution}", year="2010", howpublished="\url{https://reference.wolfram.com/language/ref/BernoulliGraphDistribution.html}", note=[Accessed: 18-August-2026]}
BibLaTeX
@online{reference.wolfram_2026_bernoulligraphdistribution, organization={Wolfram Research}, title={BernoulliGraphDistribution}, year={2010}, url={https://reference.wolfram.com/language/ref/BernoulliGraphDistribution.html}, note=[Accessed: 18-August-2026]}