

DecisionTreeModel
訓練されていない決定木を表す.
DecisionTreeModel[hpars]
カスタムのハイパーパラメータ hpars を使う.
DecisionTreeModel[hpars,vars]
提供された変数 vars を使う.
詳細
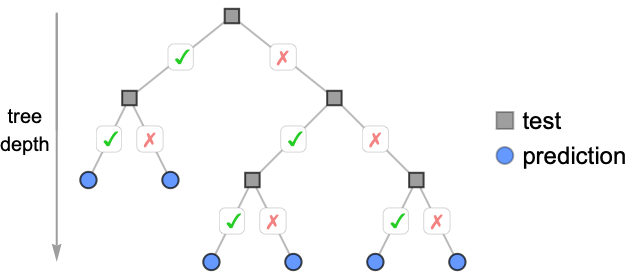
- DecisionTreeModelは,分類あるいは回帰のタスクを,単一の入力特徴に基づく一連のバイナリ選択としてモデル化する.
- 決定木は,通常,混合型(カテゴリ的なものと数値的なもの)のデータを使って,非線形の関係と複数クラスの問題をモデル化する.
- 決定木では,各内部ノードはテストを,各葉は最終的な値を表す.
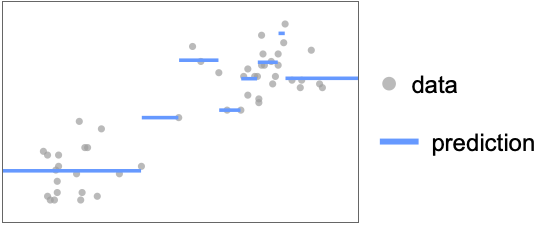
- 決定木の予測は,一般に,連続的ではない.
- 決定木の制御には,以下のパイパーパラメータが指定できる.
-
"MaxDepth" 10 枝ごとの分割の最大数 "MinGain" Scaled[0.01] 分割を保持する最小ゲイン "MinLeafSamples" 1 葉のノードごとの最小サンプル数 "MinSamples" 5 分割を考慮するための最小サンプル数 - 分割はモデル損失によって評価され,回帰では二乗平均平方根誤差,分類ではジニ指数が用いられる.
- "MaxDepth" はモデルの複雑さを制御する.値が大きいほど木は深くなり,過剰フィットを起こしやすくなり,値が小さいほど木は浅くなり,フィット不足となる可能性がある.
- 分割は,損失を少なくとも"MinGain"だけ減少させる場合にのみ保持される."MinGain" Scaled[f]の場合,閾値は絶対値ではなく,分割されるノードの損失の f 倍となる.
- "MinSamples"は,ノードが分割の対象として考慮されるために必要な最小サンプル数であり,"MinLeafSamples"は,分割が受け入れられるために各結果子ノードが含まなければならない最小数である.
値を小さくすると,ノイズが増える代りに,より細かい分割が生成される. - 変数は,指定されていなければx[i]を使って自動的に列挙される.
- 有効な変数指定 vars には次が含まれる.
-
n 変数の数 symb 単一の変数の記号的表現 {symb1,…} 記号変数のリスト - モデルの特性は,Information[PowerModel[…],prop]を用いて取得できる.
- 有効な基本特性には次のものが含まれる.
-
"BaseType" モデルの基底型 "Name" モデル名 "ShortName" ラベルとして使用する短い識別子 "InputType" サポートされる入力型 "OutputType" サポートされる出力型 - 有効なデータ関連の特性には以下がある.
-
"ColumnNames" 入力特徴の名称 "ColumnVariableMap" 列名とモデル変数との対応関係 "InputSize" 入力の次元数 "OutputSize" 出力の次元数 "Trainable" モデルが完全に指定されていて学習可能であるかどうか "Trained" モデルが数値的に評価可能であるかどうか "VariableColumnMap" モデル変数と列名との対応関係 "Variables" モデル変数の名称 - 最良モデルに関連する特性には,以下がある.
-
"Expression" モデルの式 "Function" 純関数としてのモデル "SymbolicExpression" 記号パラメータを含むモデルの式 "TabularFunction" 表形式の行に対して動作するのに適した純関数 - パラメータに関連する特性には,以下がある.
-
"Parameters" 存在する場合はパラメータ値,それ以外の場合は名称 "ParameterValues" パラメータ値 - ハイパーパラメータに関連する特性には以下が含まれる.
-
"HyperparameterDefaultDomain" デフォルトのハイパーパラメータ探索領域 "HyperparameterDomain" 指定されたハイパーパラメータ探索領域 "Hyperparameters" ハイパーパラメータの値
ハイパーパラメータ


変数
特性
例題
すべて開く すべて閉じる例 (3)
DecisionTreeModel[]DecisionTreeModel[<|"MaxDepth" -> 20, "MinSamples" -> 7|>]フィッシャーのアヤメについてのデータ集合で決定木分類器を訓練する:
model = ModelFit[ResourceData["Sample Tabular Data: Fisher Iris"] -> "Species", DecisionTreeModel[]]Information[model, "Tree"]スコープ (22)
ハイパーパラメータ (8)
"MaxDepth" (2)
DecisionTreeModel[]DecisionTreeModel["MaxDepth" -> 3]data = {...};modelDefault = ModelFit[data, DecisionTreeModel[]]Information[modelDefault, "Tree"]model = ModelFit[data, DecisionTreeModel["MaxDepth" -> 3]]Information[model, "Tree"]Plot[{modelDefault[x], model[x]}, {x, 0, 100}, PlotLabels -> {"Default", "MaxDepth" -> 3}, Exclusions -> None, PlotLayout -> "Row", Prolog -> Point[data]]"MinGain" (3)
data = Sin[Range[100] / 10.];
model = ModelFit[data, DecisionTreeModel["MinGain" -> .1]]ListPlot[data, PlotFit -> model]data = Sin[Range[100] / 10.];
model = ModelFit[data, DecisionTreeModel["MinGain" -> 0]]ListPlot[data, PlotFit -> model]model = ModelFit[Sin[Range[100] / 10.], DecisionTreeModel["MinGain" -> 0. | 0.01 | .1 | .5]]Information[model, "Hyperparameters"]"MinSamples" (2)
"MinSamples" (1)
data = {...};model10 = ModelFit[data, DecisionTreeModel["MinSamples" -> 10]]Information[model10, "Tree"]より小さい値を使用すると,葉がより多い,より茂った木になり,過剰フィットのリスクが生じる:
model2 = ModelFit[data, DecisionTreeModel["MinSamples" -> 2]]Information[model2, "Tree"]PlotGrid[{{ListPlot[data, PlotFit -> model10],
ListPlot[data, PlotFit -> model2]}}]変数 (3)
DecisionTreeModel[Automatic, 2]DecisionTreeModel[Automatic, {x, y, z}]ModelFitは,変数の数がデータ点の次元よりも1少ないと仮定する:
ModelFit[{{1, 9, 55}, {1, 1, 7}, {1, 4, 25}, {8, 9, 118}, {8, 10, 124}, {8, 5, 94}}, DecisionTreeModel[]]評価 (4)
ModelFit[{...}, DecisionTreeModel[]][{1, 2}]ModelFit[{...}, DecisionTreeModel[]][{x, y}]ModelFit[{...}, DecisionTreeModel[]][{{1.17841, 7.0408}, {7.8774, 3.20304}, {5.12858, 7.89375}}]DecisionTreeModel[2, 1][x]情報 (5)
Information[DecisionTreeModel[]]情報の中には,変数またはパラメータが完全に指定されていないと入手できないものもある:
Information[DecisionTreeModel[Association["Hyperparameters" -> Association["MaxDepth" -> 10, "MinSamples" -> 5,
    "MinLeafSamples" -> 1, "MinGain" -> 0.01]],
 Association["ParameterValues" -> Association["Feature" -> 1, "Threshold" -> 4, "Gain" -> 1722.25,
    "Size" -> 6, "FeatureType" -> "Numerical", "Left" -> Association["Value" -> Around[29., 14.],
      "Size" -> 3], "Right" -> Association["Value" -> Around[112., 9.16515138991168],
"Size" -> 3]]], Association["Variables" -> {x}]]]Information[DecisionTreeModel[Association["Hyperparameters" -> Association["MaxDepth" -> 10, "MinSamples" -> 5,
"MinLeafSamples" -> 1, "MinGain" -> 0.01]],
Association["ParameterValues" -> Association["Feature" -> 1, "Threshold" -> 4, "Gain" -> 1722.25,
"Size" -> 6, "FeatureType" -> "Numerical", "Left" -> Association["Value" -> Around[29., 14.],
"Size" -> 3], "Right" -> Association["Value" -> Around[112., 9.16515138991168],
"Size" -> 3]]], Association["Variables" -> {x}]], "Variables"]Information[DecisionTreeModel[Association["Hyperparameters" -> Association["MaxDepth" -> 10, "MinSamples" -> 5,
"MinLeafSamples" -> 1, "MinGain" -> 0.01]],
Association["ParameterValues" -> Association["Feature" -> 1, "Threshold" -> 4, "Gain" -> 1722.25,
"Size" -> 6, "FeatureType" -> "Numerical", "Left" -> Association["Value" -> Around[29., 14.],
"Size" -> 3], "Right" -> Association["Value" -> Around[112., 9.16515138991168],
"Size" -> 3]]], Association["Variables" -> {x}]], {"Variables", "Hyperparameters"}]Information[DecisionTreeModel[Automatic, 2], {"Variables", "Hyperparameters"}]アプリケーション (4)
基本的な用法 (1)
データのモデリング (3)
titanicData = ResourceData["Sample Tabular Data: Titanic"]高度に正規化された決定木モデルを使用して,生存の最良の予測因子を理解する:
model = ModelFit[titanicData, DecisionTreeModel[<|"MinGain" -> .1|>]]Information[model, "Tree"]data = ResourceData["Sample Data: Old Faithful Eruptions"];ListPlot[data]決定木を使って,待ち時間に基づく最も可能性の高い期間を予測する:
model = ModelFit[data -> "WaitingTime", DecisionTreeModel[]]Show[
ListPlot[data],
Plot[model[x], {x, Quantity[1, "Minutes"], Quantity[5, "Minutes"]}]
]各セクション内のノイズの過剰フィットを回避するために"MinLeafSamples"の値を増やす:
modelRegularized = ModelFit[data -> "WaitingTime", DecisionTreeModel[<|"MinLeafSamples" -> 30|>]]Show[
ListPlot[data],
Plot[modelRegularized[x], {x, Quantity[1, "Minutes"], Quantity[5, "Minutes"]}]
]フィッシャーのアヤメについてのデータ集合からデータを取り出す:
data = ResourceData["Sample Tabular Data: Fisher Iris"]model = ModelFit[data -> "Species", DecisionTreeModel[]]Union@Cases[Information[model, "TabularFunction"], Slot[name_] :> name, All]予測器として使われているのは"PetalLength"と"PetalWidth"だけである.データをその空間でプロットする:
petalData = GroupBy[data, #"Species"&, KeyTake[{"PetalWidth", "PetalLength"}]];ListPlot[Normal /@ petalData, AxesLabel -> {"Width", "Length"}]predictions = Table[model[<|"PetalWidth" -> Quantity[w, "Centimeters"], "PetalLength" -> Quantity[l, "Centimeters"], "SepalWidth" -> Quantity[1, "Centimeters"], "SepalLength" -> Quantity[1, "Centimeters"]|>], {w, 0, 2.5, .1}, {l, 0, 7, .2}];colors = {"setosa" -> Opacity[0.2, RGBColor[0.4, 0.6, 1]], "versicolor" -> Opacity[0.2, RGBColor[0.98, 0.56, 0.17]], "virginica" -> Opacity[0.2, RGBColor[0.14, 0.8, 0.14]]};regions = ArrayPlot[Replace[predictions, colors, {2}], ...]データとDecisionTreeModelによってマッピングされた領域を比較する:
Show[ListPlot[Normal /@ petalData], regions, {...}]考えられる問題 (2)
DecisionTreeModel[]DecisionTreeModelはフィットなしには評価できない:
DecisionTreeModel[][{Quantity[3, "Minutes"]}]model = ModelFit[ResourceData["Sample Data: Old Faithful Eruptions"], DecisionTreeModel[]];
model[{Quantity[3, "Minutes"]}]DecisionTreeModelは,ノイズの多いデータ集合では過剰フィットする傾向がある:
data = ResourceData["Sample Data: Old Faithful Eruptions"];
model = ModelFit[data, DecisionTreeModel[]]
Show[
	ListPlot[data, PlotStyle -> StandardGray],
	Plot[model[x], {x, Quantity[1, "Minutes"], Quantity[6, "Minutes"]}]
	]
ハイパーパラメータは,木がデータを分割する方法を制御し,過剰フィットを減らすためのさまざまな方法を提供する:
spec = {"MaxDepth" -> 2, "MinGain" -> 2, "MinSamples" -> 100, "MinLeafSamples" -> 20};models = ModelFit[ data, DecisionTreeModel[#]]& /@ spec;PlotGrid[Partition[MapThread[Show[
ListPlot[data, PlotStyle -> { StandardGray, Opacity[0.5]}],
Plot[#[x], {x, Quantity[1, "Minutes"], Quantity[6, "Minutes"]}],
PlotLabel -> #2
]&, {models, spec}], 2], ImageSize -> Medium]インタラクティブな例題 (1)
Manipulate[Module[{model, data},
	data = BlockRandom[Sin[Range[1000] / 100.] + RandomReal[{-.1, .1}, 1000]];model = N@ModelFit[data,
	DecisionTreeModel[<|"MaxDepth" -> depth, "MinSamples" -> samples, "MinGain" -> gain, "MinLeafSamples" -> leafsamples|>], "Function"];
	ListPlot[{data, model /@ Range[1000.]}, Joined -> {False, True}, InterpolationOrder -> 0, PlotStyle -> {Opacity[.5], Thickness[0.01]}, ImageSize -> Medium]
], {{depth, 3}, 0, 10, 1}, {{samples, 10}, 1, 20, 1}, {{leafsamples, 5}, 1, 20, 1}, {gain, 0, .15}]テキスト
Wolfram Research (2026), DecisionTreeModel, Wolfram言語関数, https://reference.wolfram.com/language/ref/DecisionTreeModel.html.
CMS
Wolfram Language. 2026. "DecisionTreeModel." Wolfram Language & System Documentation Center. Wolfram Research. https://reference.wolfram.com/language/ref/DecisionTreeModel.html.
APA
Wolfram Language. (2026). DecisionTreeModel. Wolfram Language & System Documentation Center. Retrieved from https://reference.wolfram.com/language/ref/DecisionTreeModel.html