

DecisionTreeModel
表示一个未经训练的决策树模型.
DecisionTreeModel[hpars]
使用自定义超参数 hpars.
DecisionTreeModel[hpars,vars]
使用提供的变量 vars.
更多信息
- DecisionTreeModel 将分类或回归任务建模为基于单个输入特征的一系列二元选择.
- 决策树通常用于处理混合类型数据(分类数据和数值数据),以对非线性关系和多类别问题进行建模.
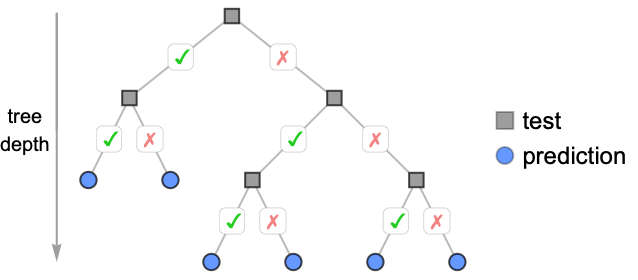
- 在决策树中,每个内部节点代表一个测试,每个叶节点代表一个最终值.
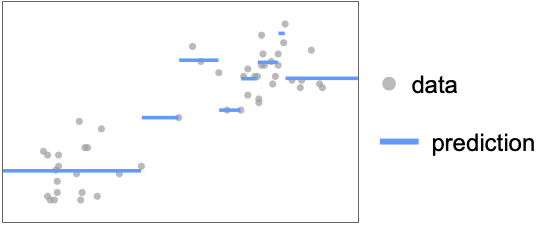
- 决策树的预测结果通常不是连续的.
- 可以指定以下超参数来控制决策树:
-
"MaxDepth" 10 每个分支的最大分裂次数 "MinGain" 0.01 保持分裂所需的最小增益 "MinLeafSamples" 1 每个叶节点的最小样本数 "MinSamples" 5 考虑分裂所需的最小样本数 - 分裂由模型损失来评估:回归使用均方根误差,分类使用 Gini 指数.
- 通过调整 "MaxDepth" 参数可以直接控制模型的复杂度. 较大的值会生成更大的决策树,容易导致过拟合;较小的值会生成更小、更快的决策树,但可能导致欠拟合.
- 只有当分裂将损失减少至少 "MinGain" 时,才会保留该分裂. 当 "MinGain" Scaled[f] 时,阈值是正在被分裂节点损失的 f 倍,而不是一个绝对值.
- "MinSamples" 是节点被考虑进行分裂所需的最小样本数;"MinLeafSamples" 是分裂被接受时每个生成的子节点必须包含的最小样本数.
较小的值会产生更精细的分裂,但代价是引入更多噪声. - 若未指定,变量将自动使用 x[i] 进行枚举.
- 有效的变量规范 vars 包括:
-
n 变量的数量 symb 单个变量的符号表示 {symb1,…} 符号变量列表 - 可以使用 Information[PowerModel[…],prop] 提取模型属性.
- 有效的基本属性包括:
-
"BaseType" 模型基本类型 "Name" 模型名称 "ShortName" 用作标签的简短标识符 "InputType" 支持的输入类型 "OutputType" 支持的输出类型 - 有效的数据相关属性包括:
-
"ColumnNames" 输入特征的名称 "ColumnVariableMap" 列名与模型变量之间的映射 "InputSize" 输入的维度 "OutputSize" 输出的维度 "Trainable" 模型是否已完全指定并可训练 "Trained" 模型是否可以进行数值求值 "VariableColumnMap" 模型变量与列名之间的映射 "Variables" 模型变量的名称 - 最佳模型相关的属性包括:
-
"Expression" 模型表达式 "Function" 作为纯函数的模型 "SymbolicExpression" 带符号参数的模型表达式 "TabularFunction" 适用于表格行的纯函数 - 参数相关的属性包括:
-
"Parameters" 参数值(若存在);否则为参数名称 "ParameterValues" 参数值 - 超参数相关的属性包括:
-
"HyperparameterDefaultDomain" 默认的超参数搜索域 "HyperparameterDomain" 指定的超参数搜索域 "Hyperparameters" 超参数值
超参数


变量
属性
范例
打开所有单元 关闭所有单元基本范例 (3)
DecisionTreeModel[]DecisionTreeModel[<|"MaxDepth" -> 20, "MinSamples" -> 7|>]model = ModelFit[ResourceData["Sample Tabular Data: Fisher Iris"] -> "Species", DecisionTreeModel[]]Information[model, "Tree"]范围 (22)
超参数 (8)
"MaxDepth" (2)
DecisionTreeModel[]DecisionTreeModel["MaxDepth" -> 3]data = {...};modelDefault = ModelFit[data, DecisionTreeModel[]]Information[modelDefault, "Tree"]model = ModelFit[data, DecisionTreeModel["MaxDepth" -> 3]]Information[model, "Tree"]Plot[{modelDefault[x], model[x]}, {x, 0, 100}, PlotLabels -> {"Default", "MaxDepth" -> 3}, Exclusions -> None, PlotLayout -> "Row", Prolog -> Point[data]]"MinGain" (3)
data = Sin[Range[100] / 10.];
model = ModelFit[data, DecisionTreeModel["MinGain" -> .1]]ListPlot[data, PlotFit -> model]data = Sin[Range[100] / 10.];
model = ModelFit[data, DecisionTreeModel["MinGain" -> 0]]ListPlot[data, PlotFit -> model]model = ModelFit[Sin[Range[100] / 10.], DecisionTreeModel["MinGain" -> 0. | 0.01 | .1 | .5]]Information[model, "Hyperparameters"]"MinLeafSamples" (2)
"MinSamples" (1)
data = {...};model10 = ModelFit[data, DecisionTreeModel["MinSamples" -> 10]]Information[model10, "Tree"]使用较低的值会导致树更加繁茂,叶节点更多,并有过拟合的风险:
model2 = ModelFit[data, DecisionTreeModel["MinSamples" -> 2]]Information[model2, "Tree"]PlotGrid[{{ListPlot[data, PlotFit -> model10],
ListPlot[data, PlotFit -> model2]}}]变量 (3)
DecisionTreeModel[Automatic, 2]DecisionTreeModel[Automatic, {x, y, z}]ModelFit 将假设变量数比数据点维度少一个:
ModelFit[{{1, 9, 55}, {1, 1, 7}, {1, 4, 25}, {8, 9, 118}, {8, 10, 124}, {8, 5, 94}}, DecisionTreeModel[]]求值 (4)
ModelFit[{...}, DecisionTreeModel[]][{1, 2}]ModelFit[{...}, DecisionTreeModel[]][{x, y}]ModelFit[{...}, DecisionTreeModel[]][{{1.17841, 7.0408}, {7.8774, 3.20304}, {5.12858, 7.89375}}]DecisionTreeModel[2, 1][x]信息 (5)
Information[DecisionTreeModel[]]Information[DecisionTreeModel[Association["Hyperparameters" -> Association["MaxDepth" -> 10, "MinSamples" -> 5,
"MinLeafSamples" -> 1, "MinGain" -> 0.01]],
Association["ParameterValues" -> Association["Feature" -> 1, "Threshold" -> 4, "Gain" -> 1722.25,
"Size" -> 6, "FeatureType" -> "Numerical", "Left" -> Association["Value" -> Around[29., 14.],
"Size" -> 3], "Right" -> Association["Value" -> Around[112., 9.16515138991168],
"Size" -> 3]]], Association["Variables" -> {x}]]]Information[DecisionTreeModel[Association["Hyperparameters" -> Association["MaxDepth" -> 10, "MinSamples" -> 5,
"MinLeafSamples" -> 1, "MinGain" -> 0.01]],
Association["ParameterValues" -> Association["Feature" -> 1, "Threshold" -> 4, "Gain" -> 1722.25,
"Size" -> 6, "FeatureType" -> "Numerical", "Left" -> Association["Value" -> Around[29., 14.],
"Size" -> 3], "Right" -> Association["Value" -> Around[112., 9.16515138991168],
"Size" -> 3]]], Association["Variables" -> {x}]], "Variables"]Information[DecisionTreeModel[Association["Hyperparameters" -> Association["MaxDepth" -> 10, "MinSamples" -> 5,
"MinLeafSamples" -> 1, "MinGain" -> 0.01]],
Association["ParameterValues" -> Association["Feature" -> 1, "Threshold" -> 4, "Gain" -> 1722.25,
"Size" -> 6, "FeatureType" -> "Numerical", "Left" -> Association["Value" -> Around[29., 14.],
"Size" -> 3], "Right" -> Association["Value" -> Around[112., 9.16515138991168],
"Size" -> 3]]], Association["Variables" -> {x}]], {"Variables", "Hyperparameters"}]Information[DecisionTreeModel[Automatic, 2], {"Variables", "Hyperparameters"}]应用 (4)
基本用法 (1)
数据建模 (3)
titanicData = ResourceData["Sample Tabular Data: Titanic"]model = ModelFit[titanicData, DecisionTreeModel[<|"MinGain" -> .1|>]]Information[model, "Tree"]data = ResourceData["Sample Data: Old Faithful Eruptions"];ListPlot[data]model = ModelFit[data -> "WaitingTime", DecisionTreeModel[]]Show[
ListPlot[data],
Plot[model[x], {x, Quantity[1, "Minutes"], Quantity[5, "Minutes"]}]
]增加 "MinLeafSamples" 的值,以避免对每个分区内噪声的过度拟合:
modelRegularized = ModelFit[data -> "WaitingTime", DecisionTreeModel[<|"MinLeafSamples" -> 30|>]]Show[
ListPlot[data],
Plot[modelRegularized[x], {x, Quantity[1, "Minutes"], Quantity[5, "Minutes"]}]
]data = ResourceData["Sample Tabular Data: Fisher Iris"]model = ModelFit[data -> "Species", DecisionTreeModel[]]Union@Cases[Information[model, "TabularFunction"], Slot[name_] :> name, All]只使用 "PetalLength" 和 "PetalWidth" 作为预测变量. 在该空间中绘制数据:
petalData = GroupBy[data, #"Species"&, KeyTake[{"PetalWidth", "PetalLength"}]];ListPlot[Normal /@ petalData, AxesLabel -> {"Width", "Length"}]predictions = Table[model[<|"PetalWidth" -> Quantity[w, "Centimeters"], "PetalLength" -> Quantity[l, "Centimeters"], "SepalWidth" -> Quantity[1, "Centimeters"], "SepalLength" -> Quantity[1, "Centimeters"]|>], {w, 0, 2.5, .1}, {l, 0, 7, .2}];colors = {"setosa" -> Opacity[0.2, RGBColor[0.4, 0.6, 1]], "versicolor" -> Opacity[0.2, RGBColor[0.98, 0.56, 0.17]], "virginica" -> Opacity[0.2, RGBColor[0.14, 0.8, 0.14]]};regions = ArrayPlot[Replace[predictions, colors, {2}], ...]将数据与 DecisionTreeModel 映射出的域进行比较:
Show[ListPlot[Normal /@ petalData], regions, {...}]可能存在的问题 (2)
DecisionTreeModel[]若不进行拟合,DecisionTreeModel 无法求值:
DecisionTreeModel[][{Quantity[3, "Minutes"]}]model = ModelFit[ResourceData["Sample Data: Old Faithful Eruptions"], DecisionTreeModel[]];
model[{Quantity[3, "Minutes"]}]DecisionTreeModel 在包含噪声的数据集上容易出现过拟合:
data = ResourceData["Sample Data: Old Faithful Eruptions"];
model = ModelFit[data, DecisionTreeModel[]]
Show[
	ListPlot[data, PlotStyle -> StandardGray],
	Plot[model[x], {x, Quantity[1, "Minutes"], Quantity[6, "Minutes"]}]
]spec = {"MaxDepth" -> 2, "MinGain" -> 2, "MinSamples" -> 100, "MinLeafSamples" -> 20};models = ModelFit[ data, DecisionTreeModel[#]]& /@ spec;PlotGrid[Partition[MapThread[Show[
ListPlot[data, PlotStyle -> { StandardGray, Opacity[0.5]}],
Plot[#[x], {x, Quantity[1, "Minutes"], Quantity[6, "Minutes"]}],
PlotLabel -> #2
]&, {models, spec}], 2], ImageSize -> Medium]互动范例 (1)
Manipulate[Module[{model, data},
	data = BlockRandom[Sin[Range[1000] / 100.] + RandomReal[{-.1, .1}, 1000]];model = N@ModelFit[data,
	DecisionTreeModel[<|"MaxDepth" -> depth, "MinSamples" -> samples, "MinGain" -> gain, "MinLeafSamples" -> leafsamples|>], "Function"];
	ListPlot[{data, model /@ Range[1000.]}, Joined -> {False, True}, InterpolationOrder -> 0, PlotStyle -> {Opacity[.5], Thickness[0.01]}, ImageSize -> Medium]
], {{depth, 3}, 0, 10, 1}, {{samples, 10}, 1, 20, 1}, {{leafsamples, 5}, 1, 20, 1}, {gain, 0, .15}]文本
Wolfram Research (2026),DecisionTreeModel,Wolfram 语言函数,https://reference.wolfram.com/language/ref/DecisionTreeModel.html.
CMS
Wolfram 语言. 2026. "DecisionTreeModel." Wolfram 语言与系统参考资料中心. Wolfram Research. https://reference.wolfram.com/language/ref/DecisionTreeModel.html.
APA
Wolfram 语言. (2026). DecisionTreeModel. Wolfram 语言与系统参考资料中心. 追溯自 https://reference.wolfram.com/language/ref/DecisionTreeModel.html 年