

SpatialEstimate
SpatialEstimate[{loc1val1,loc2val2,…}]
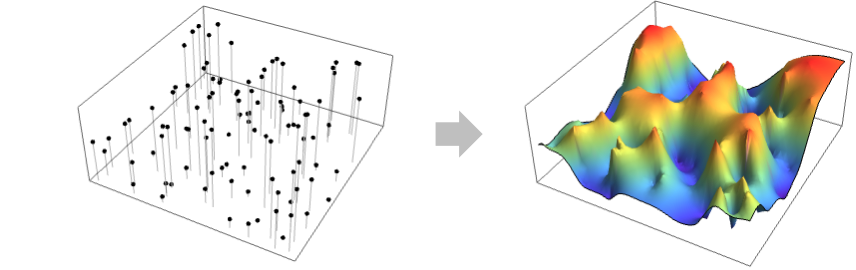
creates a spatial prediction from values vali given at locations loci.
SpatialEstimate[{loc1,loc2,…}{val1,val2,…}]
generates the same result.
Details and Options
- SpatialEstimate is also known as kriging, geospatial prediction or Gaussian process regression.
- SpatialEstimate returns a SpatialEstimatorFunction and is typically used to predict the value for locations other than loci. The values include things like elevation, concentrations, temperatures, etc.
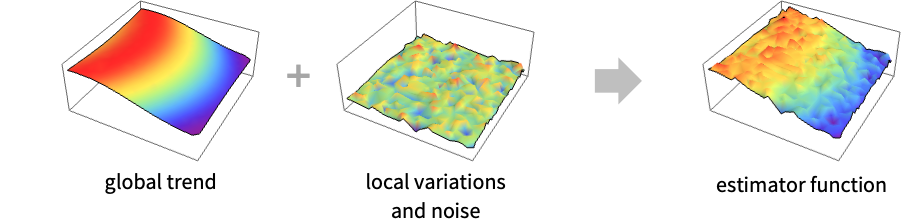
- SpatialEstimate works by identifying a global trend model and a local variation model.
- The local variations part is defined to minimize the expected prediction error
 where
where  is the true value and and
  is the predicted value.
 - There are two parts to the local variations. The VariogramFunction describes how much the value at a location is affected by nearby values, and the SpatialNoiseLevel describes how much noise there is in measurements of the values.
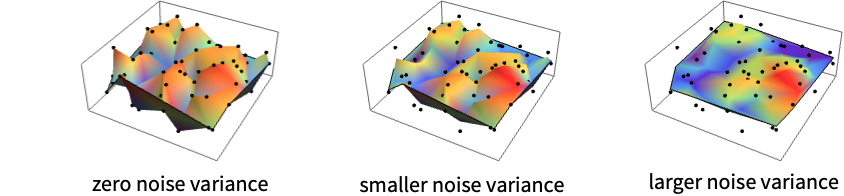
- With zero noise variance, the predictor function will interpolate through the given values. With nonzero noise variance, the predictor function will approximate the given values but not interpolate and effectively smooth out the surface. The SpatialNoiseLevel effectively gives a way to control the level of smoothing in the resulting SpatialEstimatorFunction.
- The locations loci can have the forms:
-
{p1,…,pd} geometrical locations GeoPosition[…],GeoPositionENU[…],… geographical locations - The values vali can be real numeric values or quantities.
- The following options can be given:
-
SpatialTrendFunction Automatic global trend model VariogramFunction Automatic local variation model SpatialNoiseLevel Automatic noise level in vali
Examples
open all close allBasic Examples (3)
SpatialEstimate computes a continuous function for sparse values given with locations:
data = {{0.0683671, 0.635233} -> 15.1, {0.110887, 0.823343} -> 25.5, {0.241157, 0.853893} -> 7.9, {0.260237, 1.04258} -> 19.1, {0.266257, 0.964603} -> 19.4, {0.305197, 0.619043} -> 33.4, {0.318197, 0.896843} -> 10.7, {0.376197, 1.15155} -> 29.6, {0.381077, 0.584253} -> 39.4, {0.381277, 0.595373} -> 19.4, {0.537597, 0.804043} -> 12.4, {0.550127, 1.40456} -> 10.5, {0.625677, 1.32567} -> 13.5, {0.636097, 0.758103} -> 28.5, {0.635167, 0.135353} -> 11.4, {0.717057, 1.12401} -> 33.4, {0.785927, 0.511553} -> 13.1, {0.834457, 0.0217334} -> 7.8, {0.846227, 1.14474} -> 29.8, {1.00857, 0.565023} -> 14.1};PointValuePlot[data]sef = SpatialEstimate[data]Compute estimated value at a location:
sef[{.2, .4}]Plot3D[sef[{x, y}], {x, 0, 1}, {y, 0, 1.5}]Create a continuous spatial estimator function to visualize density:
locs = {...};
vals = {...};PointValuePlot[locs -> vals]Create spatial estimator function with constant trend:
sef = SpatialEstimate[locs -> vals, SpatialTrendFunction -> 0]Visualize spatial estimator function in the observation region inferred from the locations:
DensityPlot[sef[{x, y}], {x, y}∈RipleyRassonRegion[locs]]Rainfall amounts at locations in Switzerland:
data = SpatialPointData[«2»];Show[Region[data["ObservationRegion"]], PointValuePlot[data, ColorFunction -> "Rainbow"]]Create spatial estimator function with linear trend:
spf = SpatialEstimate[data -> "Rainfall", SpatialTrendFunction -> 1]Evaluate spatial estimator function at uniform random locations in the observation region:
pts = RandomPoint[data["ObservationRegion"], 3000];PointValuePlot[pts -> spf[pts], ColorFunction -> "Rainbow", FrameTicks -> None, AspectRatio -> 2 / 3]Scope (2)
Create spatial estimator for random data:
m = 25;
data = RandomReal[1, {m, 2}] -> RandomReal[1, m];
Define a variogram model to use:
varfn = VariogramModel["Exponential", {1, 1}, SpatialNoiseLevel -> 0.1]Create spatial estimator function with the variogram model and quadratic trend:
spf = SpatialEstimate[data, VariogramFunction -> varfn, SpatialTrendFunction -> 2]spf["Visualization", "Data" -> True]Use SpatialEstimate with specified variogram function:
locs = {...};
vals = {...};PointValuePlot[locs -> vals]Create spatial estimator function with linear trend:
sef = SpatialEstimate[locs -> vals, SpatialTrendFunction -> 1]Find the variogram model used:
sef[ "VariogramModelName"]vf = EstimatedVariogramModel[locs -> vals, "Exponential"]vf["Visualization"]Compute the estimator functions with the fitted variogram model:
sef2 = SpatialEstimate[locs -> vals, VariogramFunction -> vf, SpatialTrendFunction -> 1]Compare the estimator surfaces of the two variogram models:
{sef["Visualization"], sef2["Visualization"]}Options (4)
SpatialNoiseLevel (1)
Specify noise level using SpatialNoiseLevel:
m = 30;
{datapoints, datavalues} = RandomReal[1, {2, m}];
data = datapoints -> datavalues;
Create spatial estimator function with positive noise level:
spf = SpatialEstimate[data, SpatialNoiseLevel -> .1]spf["Visualization"]If the noise level is 0, SpatialEstimate interpolates exactly:
spf = SpatialEstimate[data, SpatialNoiseLevel -> 0]spf["Visualization"]SpatialTrendFunction (1)
Specify trend function using SpatialTrendFunction:
m = 25;
data = RandomReal[1, {m, 2}] -> RandomReal[1, m];PointValuePlot[data, ColorFunction -> "Rainbow"]Create spatial estimator function with constant trend:
spf0 = SpatialEstimate[data, SpatialTrendFunction -> 0]spf0["Visualization"]Create spatial estimator function with quadratic trend:
spf2 = SpatialEstimate[data, SpatialTrendFunction -> 2]spf2["Visualization"]VariogramFunction (1)
Specify variogram model using VariogramFunction:
m = 100;
SeedRandom[1];
{datapoints, datavalues} = RandomReal[1, {2, m}];
data = datapoints -> datavalues;
Create spatial estimator function with an exponential variogram model:
spf = SpatialEstimate[data, VariogramFunction -> "Exponential"]spf["Visualization", AxesOrigin -> {0, 0}]Use pre-fitted VariogramModel:
var = EstimatedVariogramModel[data, "Gaussian"]SpatialEstimate[data, VariogramFunction -> var]%["Visualization", AxesOrigin -> {0, 0}]DistanceFunction (1)
Specify a distance function using DistanceFunction:
m = 100;
data = RandomReal[1, {m, 2}] -> RandomReal[1, m];
Create a spatial estimator function with constant trend:
spf = SpatialEstimate[data, DistanceFunction -> (Norm[Subtract[#1, #2], 8]&)]spf["Visualization"]Applications (4)
Often spatial data is given on a regular grid with missing regions, for example, in satellite ozone readings:
locs = GeoPosition[{{25.5, -124.5}, {25.5, -123.5}, {25.5, -122.5}, {25.5, -121.5}, {25.5, -120.5},
  {25.5, -112.5}, {25.5, -111.5}, {25.5, -110.5}, {25.5, -109.5}, {25.5, -108.5}, {25.5, -107.5},
  {25.5, -106.5}, {25.5, -105.5}, {25.5, -104.5}, {25.5 ... 8.5, -87.5}, {48.5, -86.5},
  {48.5, -85.5}, {48.5, -84.5}, {48.5, -83.5}, {48.5, -82.5}, {48.5, -81.5}, {48.5, -80.5},
  {48.5, -79.5}, {48.5, -78.5}, {48.5, -72.5}, {48.5, -71.5}, {48.5, -70.5}, {48.5, -69.5},
{48.5, -68.5}, {48.5, -67.5}}];ozone = {...};PointValuePlot[locs -> ozone, ColorFunction -> "Rainbow"]
Create a continuous spatial estimator:
sf = SpatialEstimate[locs -> ozone]Find the estimated ozone value for a specific location:
sf[Entity["City", {"Boston", "Massachusetts", "UnitedStates"}]]Evaluate the spatial estimator function at uniform random locations in the observation region:
reg = Entity["Country", "UnitedStates"]["Polygon"];pts = RandomGeoPosition[reg, 3000]PointValuePlot[pts -> sf[pts], ColorFunction -> "Rainbow"]Use SpatialEstimate to create a continuous estimate from sparse observation locations:
data = ResourceData["Sample Data: Swiss Rainfall"]Show[Region[data["ObservationRegion"]], PointValuePlot[data, ColorFunction -> "Rainbow"]]Compute estimates using specific models:
models = {"Cubic", "Spherical", "Exponential", "Gaussian"};estimates = SpatialEstimate[data, VariogramFunction -> #]& /@ models;Create a set of random points and compute the estimated values at these locations:
pts = RandomPoint[data["ObservationRegion"], 2000];
vals = Through[estimates[pts]];
Visualize rainfall values over the whole region:
Grid@ArrayReshape[#, {2, 2}]&@MapThread[Show[Region[data["ObservationRegion"]], PointValuePlot[pts -> #1, PlotStyle -> PointSize[0.015], ColorFunction -> "Rainbow"], PlotLabel -> #2]&, {vals, models}]SpatialEstimate can create a smoother picture of the data:
locs = {...};
vals = {...};
Standard ways to visualize the data:
{PointValuePlot[locs -> vals, ColorFunction -> "Rainbow"], ListDensityPlot[ArrayFlatten[{{locs, Partition[vals, 1]}}], ColorFunction -> "Rainbow"]}Spatial estimate with smoothing:
est0 = SpatialEstimate[locs -> vals, SpatialNoiseLevel -> .0001];
est1 = SpatialEstimate[locs -> vals, SpatialNoiseLevel -> .1];
Compute estimates for random locations:
reg = Rectangle[{0, 0}, {Max[locs[[All, 1]]], Max[locs[[All, 2]]]}];pts = RandomPoint[reg, 5 * 10 ^ 3];
res0 = est0[pts];
res1 = est1[pts];MapThread[PointValuePlot[pts -> #1, PlotStyle -> PointSize[.02], ColorFunction -> "Rainbow", PlotLabel -> #2]&, {{res0, res1}, {"smaller noise level", "larger noise level"}}]Compute an estimate of the yield of the entire field:
{Mean@est0[pts, Around], Mean@est1[pts, Around]}RegionMeasure[reg]Locations of scallop samples in the Atlantic Ocean, annotated with the total number of specimens caught as well as pre-recruit and adult numbers:
obj = ResourceObject["Sample Data: Scallop Abundance"]obj["Description"]Extract the spatial point data:
data = ResourceData[obj]First select locations with positive catch numbers:
pos = Position[data["Annotations"]["Catch"], _ ? Positive];
locs = Extract[data["Points"], pos];
Compute rate of recruits relative to the catch size:
recruitsRate = Extract[data["Annotations"]["Recruits"], pos] / Extract[data["Annotations"]["Catch"], pos]//N;Use SpatialEstimate to create an estimate of recruit rates from sparse catch locations:
est = SpatialEstimate[locs -> recruitsRate, VariogramFunction -> "Gaussian"]Create a set of random points and compute the estimated values at these locations:
pts = RandomPoint[data["ObservationRegion"], 3000];
vals = est[pts];
Visualize the recruit rates over the whole observation region:
Row@{PointValuePlot[locs -> recruitsRate, ColorFunction -> "Rainbow", PlotLegends -> Automatic, PlotLabel -> "recruits rates"], PointValuePlot[pts -> vals, PlotStyle -> PointSize[Small], ColorFunction -> "Rainbow", PlotLabel -> "estimated recruits rates"]}Properties & Relations (2)
For large spatial noise levels, the spatial estimator converges to the trend function:
locs = Range[0, 1, 0.05];
vals = {...};dataPlot = ListPlot[Transpose[{locs, vals}], PlotStyle -> Green]Compute SpatialEstimate for increasing values of noise level for specified polynomial trend order:
trend = {1, 2, 3};
noise = {0, 0.01, .05, 5};
est = Table[SpatialEstimate[locs -> vals, SpatialTrendFunction -> tr, SpatialNoiseLevel -> ns]//Quiet, {ns, noise}, {tr, trend}];plots = Table[Show[dataPlot,
Plot[{est[[k, 1]][x], est[[k, 2]][x], est[[k, 3]][x]}, {x, 0, 1}], PlotLabel -> Row[{"noise level = ", noise[[k]]}]], {k, 1, 4}];
legend = LineLegend[{RGBColor[0.368417, 0.506779, 0.709798], RGBColor[0.880722, 0.611041, 0.142051], RGBColor[0.560181, 0.691569, 0.194885]}, {"linear", "square", "cubic"}, LegendLabel -> "trend"];
Legended[Grid[ArrayReshape[plots, {2, 2}]], legend]Only with zero SpatialNoiseLevel is SpatialEstimate an exact interpolator:
locs = Range[0, 1, 0.05];
vals = {...};dataPlot = ListPlot[Transpose[{locs, vals}], PlotStyle -> Green]Compute spatial estimate for varying values of spatial noise level:
est0 = SpatialEstimate[locs -> vals, SpatialNoiseLevel -> 0];estSmall = SpatialEstimate[locs -> vals, SpatialNoiseLevel -> 0.005];estLarge = SpatialEstimate[locs -> vals, SpatialNoiseLevel -> 0.05];Visualize the estimates with the data:
Show[dataPlot, Plot[{est0[x], estSmall[x], estLarge[x]}, {x, 0, 1}, PlotLegends -> {"zero noise level", "smaller noise level", "larger noise level"}]]Possible Issues (1)
Some variograms can be badly conditioned:
SeedRandom["bad"];
{locs, vals} = RandomReal[1, {2, 10}];
data = locs -> vals;var0 = VariogramModel["Gaussian", {1, 10}, SpatialNoiseLevel -> 0];
sef0 = SpatialEstimate[locs -> vals, VariogramFunction -> var0];The result does not represent the data well:
sef0["Visualization"]Allowing positive SpatialNoiseLevel acts as a regularization:
var1 = VariogramModel["Gaussian", {1, 10}];
sef1 = SpatialEstimate[locs -> vals, VariogramFunction -> var1];
The noise level is computed automatically:
sef1[SpatialNoiseLevel]sef1["Visualization"]Neat Examples (1)
The population data of countries in Europe:
locs = GeoPosition@EntityValue[EntityClass["Country", "Europe"], "Position"]pops = EntityValue[EntityClass["Country", "Europe"], "Population"];PointValuePlot[locs -> pops, ColorFunction -> "Rainbow"]Find estimator surface with an exponential variogram model and two different trend models:
spfConstTrend = SpatialEstimate[locs -> pops, VariogramFunction -> "Exponential", SpatialTrendFunction -> 0]spfLinearTrend = SpatialEstimate[locs -> pops, VariogramFunction -> "Exponential", SpatialTrendFunction -> 2]samples = RandomGeoPosition[Entity["GeographicRegion", "Europe"]["Polygon"], 600]PointValuePlot[samples -> #[samples], ColorFunction -> "Rainbow"]& /@ {spfConstTrend, spfLinearTrend}Text
Wolfram Research (2021), SpatialEstimate, Wolfram Language function, https://reference.wolfram.com/language/ref/SpatialEstimate.html.
CMS
Wolfram Language. 2021. "SpatialEstimate." Wolfram Language & System Documentation Center. Wolfram Research. https://reference.wolfram.com/language/ref/SpatialEstimate.html.
APA
Wolfram Language. (2021). SpatialEstimate. Wolfram Language & System Documentation Center. Retrieved from https://reference.wolfram.com/language/ref/SpatialEstimate.html