 Setting a Breakpoint
In a debug session, you can halt a Mathematica computation and inspect its state.
 Setting a Breakpoint
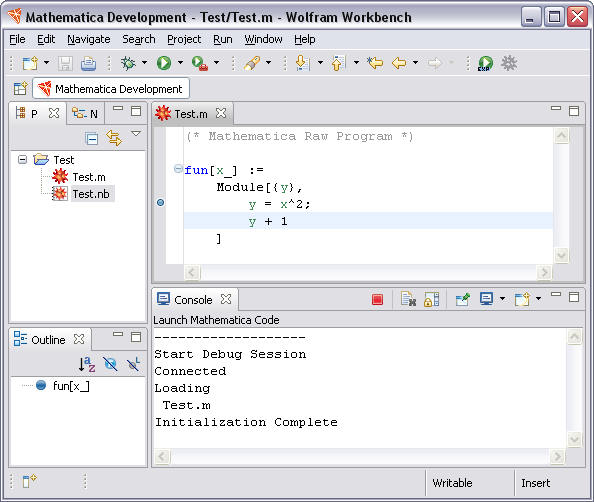
One way to halt a computation is to trigger a breakpoint. The Workbench supports a number of different types of breakpoints. The most common is a code breakpoint, which causes execution to halt when a line of code is executed. More information on breakpoints is found in the section on breakpoint types.
To create a code breakpoint, make
sure that the file is open in the Workbench
(how to open a file).
Then, place the cursor in the left margin
of the file and double-click. A blue marker should
appear; this means that a breakpoint has been set.

 Hitting a Breakpoint
Now you should evaluate a command in Mathematica
that will hit this breakpoint. Type fun[10] into
the notebook, and evaluate this in the
normal way for Mathematica. When the breakpoint is
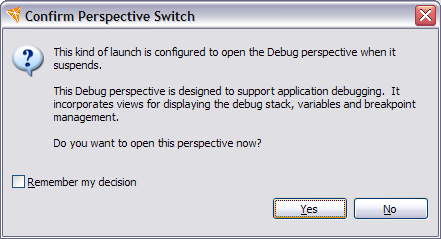
hit, the Workbench switches into the Debug perspective.
Typically it will ask if you want to make the switch.

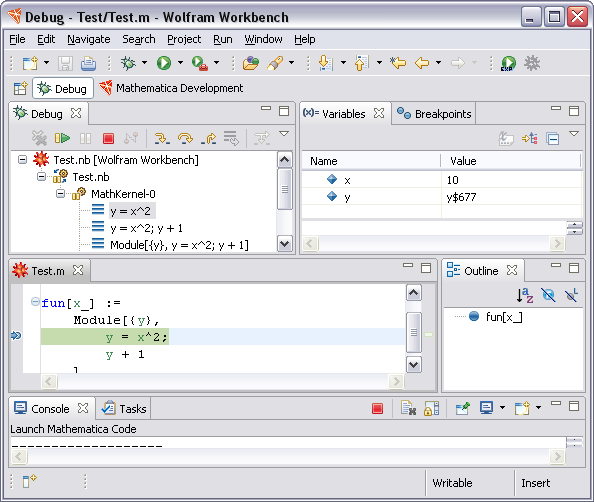
Click Yes, and the Debug perspective will open. This shows a number of new views, such as the Mathematica execution stack, variables that are in scope for a particular stack frame, and breakpoints. If you do not see any of these, then you may have to open the relevant view. Use the menu bar Window > Show View and choose the view that you want to open. Alternatively, resetting the perspective may help to display the correct views.

 What to Do at a Breakpoint
In the Debug view, you can click the different stack frames. Often, when you do this, the source in the editor changes (to show the original line of code), and the variables change (to show those that are in scope).
The toolbar at the top of the Debug view has a number of controls.
These allow you to
resume the computation
 ,
step to the next line
 ,
kill the Mathematica kernel session
 , and perform a number of
other operations.
If you click the resume button, the computation will run to the end, and the result of the computation will appear in the notebook from which the computation was launched.