 Code Breakpoints
The Wolfram Workbench supports three types of breakpoints: those that halt when a line of code is reached, when a Mathematica message is generated, and when a symbol is used for a function definition. When you reach a breakpoint, you can inspect the execution stack and look at local variables. More information on what to do at a breakpoint is found in the section on debugging.
 Code Breakpoints
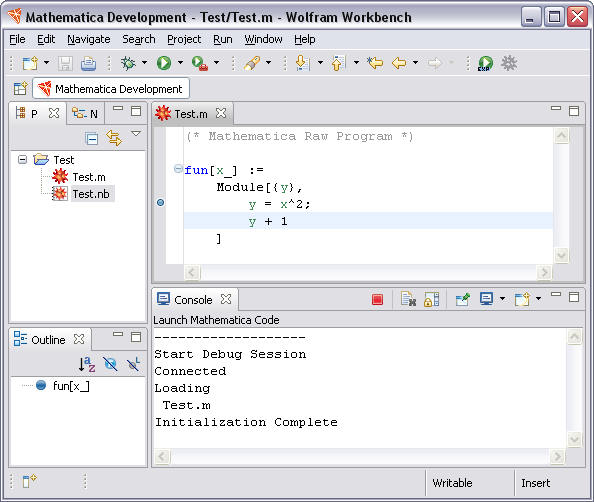
Code breakpoints are tied to a particular line of code. When execution reaches a line of code with a code breakpoint, it will halt.
To set a code breakpoint, you should
first make
sure that the file is open in the Workbench
(how to open a file).
Then place the cursor in the left margin
of the file and double-click. A blue marker should
appear; this means that a breakpoint has been set.

 Message Breakpoint
A message breakpoint is tied to the generation of messages by Mathematica. When a message is generated, execution will halt. These breakpoints can be particularly useful if your code is going wrong and generating errors.
To set a message breakpoint, you can use the
button,![]() ,
found in the Breakpoints view
toolbar.
,
found in the Breakpoints view
toolbar.
Another way to set a code breakpoint is to use the
Run menu.
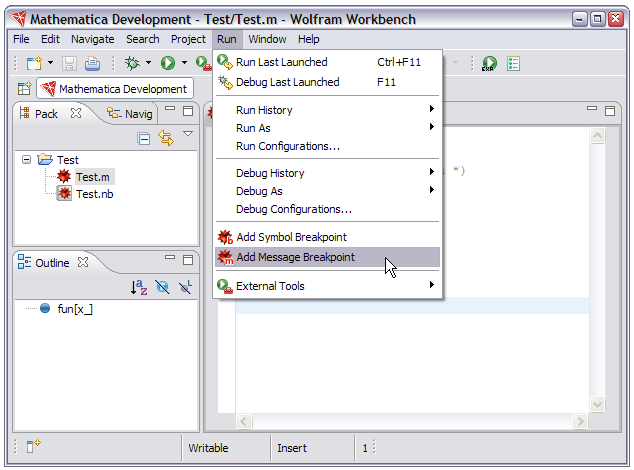
From the menu bar, select Run > Add Message Breakpoint.
This is shown below.

 Symbol Breakpoints
A symbol breakpoint is tied to usage of a symbol. If you set a symbol breakpoint, then any call to a function with that name will cause execution to halt. This is particularly useful if you have many function definitions that have the same name.
To set a symbol breakpoint, you should select
the symbol in your code and then click
Set Breakpoint on the selection button
found in the toolbar,
 .
.
Another way to set a symbol breakpoint is select the symbol and use the Run menu. From the menu bar, select Run > Add Symbol Breakpoint.