Water Condensation of Passive Dew Condensers
Introduction
A passive dew condenser (PDC) is a device that collects water from the atmosphere without using a power source [Beysens, 2018]. These devices aim to provide an alternative water source, so the scientific community is looking for ways to optimize the efficiency of PDC devices in collecting water.
The PDE model created here will be compared to an actual device located in Mirleft, Morocco [Lekouch et al., 2012], showing how much water is collected in approximately 24 hours.
A visualization of the device and the experimental setup can be seen in [Lekouch et al., 2012]. This simulation uses the data obtained in this experiment, given in Appendix 1 of [Flores-Castillo, 2022], and compares the measured amount of water with the simulation results.
This tutorial explains how to simulate a transient model of a PDC using actual meteorological data in order to estimate the dew yield. The model considers the surface characteristics of the PDC, such as the material and the tilt angle and external variables, including meteorological parameters, such as ambient temperature, relative humidity, cloud cover and solar radiation. This model can be used as a tool to optimize and design better PDC devices. The scientific model presented here is based on [Flores-Castillo, 2022] and is a two-dimensional model of a PDC.
A passive dew collector works under the meteorological phenomenon called dew. The formation of dew corresponds to the process of water vapor from the atmosphere condensing on a surface [Beysens, 2018]. For dew to form on a surface, the surface must have a temperature below the dew point temperature. The dew point temperature is defined as the temperature to which humid air must be cooled to become saturated. In other words, right at the dew point, water vapor condenses into a liquid at the same rate it evaporates, assuming a constant pressure. Thus, on a surface with a temperatures below the dew point, more liquid water will condensate than evaporate. This excess of water can be collected.
The natural releasing of thermal energy of the collector will allow the surface to cool down below the dew point. Additionally, meteorological effects and the technical conditions will affect how well the PDC surface can cool down.
The PDC device that will be used here is a planar PDC positioned at a 30° angle from the horizontal plane. A PDC is mainly composed of a condenser surface on top of an insulating material. The characteristics of the condenser surface, such as emissivity and heat capacity, will be of great importance, as they affect how much water is condensed [Flores-Castillo, 2022].
This model takes into account various physical phenomena. For example, it considers the velocities of the surrounding air, the heat transfer in the air and in the PDC device itself, and different meteorological parameters; all of which are phenomena that change over time. The complex nature of this model makes it computationally expensive in both execution time and memory.
Overview of the Passive Dew Condenser Model
In this model, a fluid dynamics model and a heat transfer model will be run sequentially. The result will then be used to feed a condensate model. In the next sections, an overview of the submodels is given.
A sketch displaying a passive dew collector reveals its components: the collector is composed of a condenser and an insulator. Air is surrounding the PDC. An airflow enters from the left boundary ![]() and exits at the right boundary
and exits at the right boundary ![]() . Note that a 2D domain with an
. Note that a 2D domain with an ![]() -
-![]() coordinate system is used.
coordinate system is used.

Depiction of a passive dew collector and its components, surrounded by air.
Fluid Dynamics Model
The fluid dynamics model will simulate the airflow over the passive dew collector. The fluid dynamics model used is a time-dependent Navier–Stokes equation. The vector-valued Navier–Stokes equation is given by:
where ![]() is the density
is the density ![]() and
and ![]() is the viscosity
is the viscosity ![]() .
. ![]() is the pressure
is the pressure ![]() and
and ![]() is the vector-valued velocity field
is the vector-valued velocity field ![]() . Its components are
. Its components are ![]() , in the
, in the ![]() and
and ![]() directions, respectively. The dependent variables to be solved for are the components of velocity
directions, respectively. The dependent variables to be solved for are the components of velocity ![]() and the relative pressure
and the relative pressure ![]() .
.
The result of the fluid dynamics model is the velocity field ![]() of the air flow over the device. This fluid velocity field solution drives the temperature distribution in the air surrounding the PDC device, necessary to know to estimate how much water is condensed.
of the air flow over the device. This fluid velocity field solution drives the temperature distribution in the air surrounding the PDC device, necessary to know to estimate how much water is condensed.
Heat Transfer Model
As the second component to PDC simulation, a heat transfer model will be used to obtain the condenser surface temperature. The surface temperature will allow you to compute the heat transfer coefficient ![]() between the condenser surface and the air surrounding it, which is needed to calculate the amount of water condensed at the surface.
between the condenser surface and the air surrounding it, which is needed to calculate the amount of water condensed at the surface.
The heat equation will be active in both the fluid region and in the PDC device. For a transient heat transfer model, the temperature distribution ![]() is described by the transient heat equation. The transient heat equation is given by:
is described by the transient heat equation. The transient heat equation is given by:
where ![]() is the constant pressure heat capacity
is the constant pressure heat capacity ![]() ,
, ![]() is the temperature
is the temperature ![]() , and
, and ![]() is the thermal conductivity
is the thermal conductivity ![]() . The air fluid flow computed with the fluid dynamics model described above is used to model the heat convected over the device. The air flow velocity
. The air fluid flow computed with the fluid dynamics model described above is used to model the heat convected over the device. The air flow velocity ![]() computed with the fluid flow model with the components
computed with the fluid flow model with the components ![]() and
and ![]() , in the
, in the ![]() and
and ![]() directions, respectively, drives the convective term
directions, respectively, drives the convective term ![]() .
.
The PDC exchanges heat with its surroundings through various effects [Flores-Castillo, 2022]. The device loses thermal energy though convection ![]() , loses or absorbs energy through radiation
, loses or absorbs energy through radiation ![]() , and absorbs energy through solar irradiance
, and absorbs energy through solar irradiance ![]() and through condensation
and through condensation ![]() .
.

A summary of the various thermal processes of heat transfer at the condenser surface of the PDC. The convective term ![]() models the air flow velocity over the device and removes thermal energy from the PDC. Radiation
models the air flow velocity over the device and removes thermal energy from the PDC. Radiation ![]() models in- and outflow of thermal energy of the PDC with the surroundings through radiation. The condensation process
models in- and outflow of thermal energy of the PDC with the surroundings through radiation. The condensation process ![]() , considered as an incoming heat flux, also affects the temperature of the device. The solar irradiance
, considered as an incoming heat flux, also affects the temperature of the device. The solar irradiance ![]() , considered as incoming heat flux, also affects the temperature of the device.
, considered as incoming heat flux, also affects the temperature of the device.
Condensation Model
The fluid flow model and the heat transfer model are accompanied by a condensation model. The condensation model allows you to compute the amount of condensate. The condensation is not modeled as a PDE but modeled through an integral.
The condensation model is based on a single equation that expresses a rate of mass change ![]() of condensed water and is described by the following equation [Beysens, 2018]:
of condensed water and is described by the following equation [Beysens, 2018]:
where ![]() is the surface area of the exposed condenser surface,
is the surface area of the exposed condenser surface, ![]()
![]() is the water pressure in the humid air above the condenser as a function of the ambient temperature
is the water pressure in the humid air above the condenser as a function of the ambient temperature ![]() , and
, and ![]()
![]() is the water vapor pressure at the condenser temperature
is the water vapor pressure at the condenser temperature ![]() .
. ![]() is the water vapor transfer coefficient and is proportional to the heat transfer coefficient
is the water vapor transfer coefficient and is proportional to the heat transfer coefficient ![]() , given by the following equation:
, given by the following equation:
where ![]()
![]() is the latent heat of evaporation, which is the heat required for water to change phase from liquid to gas, and
is the latent heat of evaporation, which is the heat required for water to change phase from liquid to gas, and ![]()
![]() is the psychrometric constant, which relates the partial pressure of water vapor in air to air temperature and is commonly used in disciplines like meteorology and climatology.
is the psychrometric constant, which relates the partial pressure of water vapor in air to air temperature and is commonly used in disciplines like meteorology and climatology.
To solve equation (1), it will be necessary to know all the variables mentioned before, particularly the heat transfer coefficient ![]() .
.
Physics Domain Coupling
In principle, the amount of condensed water can be calculated in two ways: in a serial and a segregated approach. The main difference between them is that in the serial method, the temperature of the PDC does not depend on the condensation term ![]() . Not considering the condensation term allows one to run the model sequentially, meaning that the condensation and heat transfer models are not fully coupled. That makes the serial approach simpler and faster to compute, but on the other hand, the segregated method is more accurate.
. Not considering the condensation term allows one to run the model sequentially, meaning that the condensation and heat transfer models are not fully coupled. That makes the serial approach simpler and faster to compute, but on the other hand, the segregated method is more accurate.
Serial approach
In the serial approach, the Navier–Stokes equation (2) is solved first, then the heat equation (3). After that, the heat transfer coefficient ![]() and the rest of the variables of equation (4) are calculated in order to compute the amount of water.
and the rest of the variables of equation (4) are calculated in order to compute the amount of water.
This serial solution procedure is shown in the following diagram.
Serial method to solve water condensation.
Meteorological Parameters
Using actual weather data as input for the PDE model benefits the analysis. It helps to get a more realistic and accurate result from the model at a specific geolocation. Furthermore, using actual data can help to optimize the design of devices for typical or extreme conditions.
The meteorological data used in the simulation includes the ambient temperature ![]() , the relative humidity
, the relative humidity ![]() , the dew temperature
, the dew temperature ![]() , the wind speed
, the wind speed ![]()
![]() and the cloud cover fraction
and the cloud cover fraction ![]() , which refers to the fraction of the sky obscured by clouds on average from a particular location. All meteorological parameters are time dependent.
, which refers to the fraction of the sky obscured by clouds on average from a particular location. All meteorological parameters are time dependent.
The model presented here will use data shown in Appendix I of [Flores-Castillo, 2022]. It is necessary to convert these data points into a continuous function. For that, the data is interpolated.
In addition, in the Appendix section it is shown how to use current and historical weather meteorological data from all standard weather stations worldwide available from WeatherData. With this, the performance of a passive dew collector can be estimated at any point in the world.
The meteorological variables obtained are used throughout the entire simulation.
Meteorological Functions
First, meteorological functions to be used are defined. These include the dew temperature ![]() , the sky temperatures
, the sky temperatures ![]() and
and ![]() and the sky emissivities
and the sky emissivities ![]() and
and ![]() with cloud cover fraction
with cloud cover fraction ![]() .
.
The dew temperature ![]() is dependent on the ambient temperature
is dependent on the ambient temperature ![]() and the relative humidity
and the relative humidity ![]() and is given by:
and is given by:
In equation (5), the ambient temperature ![]() must be given in
must be given in ![]() .
.
The sky emissivity ![]() , dependent on the dew temperature
, dependent on the dew temperature ![]() in
in ![]() and on the site elevation
and on the site elevation ![]() in
in ![]() , can be given by:
, can be given by:
The sky emissivity including cloud coverage ![]() is given by:
is given by:
The sky temperature ![]() is related to the ambient temperature
is related to the ambient temperature ![]() , according to the following equation:
, according to the following equation:
So the sky temperature including cloud coverage ![]() can be deduced by replacing the sky emissivity
can be deduced by replacing the sky emissivity ![]() with
with ![]() :
:
Later on, the ambient temperature ![]() , the relative humidity
, the relative humidity ![]() , the wind speed
, the wind speed ![]() and the cloud cover fraction
and the cloud cover fraction ![]() functions will be obtained using the meteorological data.
functions will be obtained using the meteorological data.
Meteorological Data from Mirleft, Morocco
To run the PDC simulation, meteorological data from Mirleft, Morocco [Lekouch et al., 2012] is used. This data is from September 28 to September 29, 2007. Since experimental data from this location exists, the model can be compared.
The geographical parameters are a latitude of ![]() and a longitude of
and a longitude of ![]() .
.
Note that for the wind speed and the cloud coverage, a GaussianFilter was applied in order to smooth the data.
Unfortunately, real-life data might have all sorts of issues, like a negative cloud cover fraction. To accommodate for these shortcomings, a cleanup function is created to deal with negative values.
For the wind speed data, it is necessary to specify a lower speed limit [Flores-Castillo, 2022], which in this case will be ![]() .
.
In general, wind speed is measured at ![]() elevation from ground. If one wants to know the velocities at lower heights, an extrapolation is needed. A classical logarithmic variation is typically used for this, which is given by:
elevation from ground. If one wants to know the velocities at lower heights, an extrapolation is needed. A classical logarithmic variation is typically used for this, which is given by:
where ![]() is the height at which the wind speed theoretically becomes zero and
is the height at which the wind speed theoretically becomes zero and ![]() is the wind velocity at
is the wind velocity at ![]() from the ground.
from the ground. ![]() is generally taken to be 0.1
is generally taken to be 0.1 ![]() [Beysens, 2018].
[Beysens, 2018].
So, to know the wind speed ![]() above ground, equation (11) is applied with
above ground, equation (11) is applied with ![]() .
.
Fluid Dynamics Model Setup
Overview
In this section, the fluid dynamics model is set up and solved. The Navier–Stokes equation is used to solve for the transient flow field ![]() that surrounds the PDC device.
that surrounds the PDC device.
The vector-valued Navier–Stokes equation is given by:
where ![]() is the density
is the density ![]() and
and ![]() is the viscosity
is the viscosity ![]() .
. ![]() is the pressure
is the pressure ![]() and
and ![]() is the vector-valued velocity field
is the vector-valued velocity field ![]() . Its components are
. Its components are ![]() , in the
, in the ![]() and
and ![]() directions, respectively. The dependent variables to be solved for are the components of velocity
directions, respectively. The dependent variables to be solved for are the components of velocity ![]() and the relative pressure
and the relative pressure ![]() .
.
To simplify matters, no external forces like gravity act. In this simulation, air is considered to be incompressible, which means that the density is constant. Additionally, to reduce the complexity of the numerical solution, natural convection is neglected, and only forced convection is considered [Flores-Castillo, 2022].
The Navier–Stokes equation will only be active in the air domain of the geometry.
Besides the fluid dynamics PDE model, it is necessary to specify boundary conditions:
- A no-slip boundary condition on the PDC walls and the ground level. No-slip means that the velocity in all directions at that surface is zero. This is a common boundary condition in fluid dynamics to model walls; however, choosing a no-slip condition on the PDC surface is essential for the heat transfer model shown below and will be explained below.
- An outflow condition
 at the right-hand side of the domain where the pressure
  is set to the arbitrary value of 0.
The relative pressure is the fluid's pressure with respect to a reference pressure. In most cases, the reference pressure ![]() is set to the ambient pressure of
is set to the ambient pressure of ![]() . When necessary, one can calculate the absolute pressure
. When necessary, one can calculate the absolute pressure ![]() of the system with the following equation:
of the system with the following equation:
This equation means that the outflow condition is set to an absolute pressure of 1 atmosphere. Initial conditions and boundary condition should be defined using relative pressure values.
Domain
The domain of analysis ![]() consists of the PDC device in gray and the surrounding fluid area in blue, as shown in the figure below.
consists of the PDC device in gray and the surrounding fluid area in blue, as shown in the figure below.

Domain of analysis Ω with the PDC device in gray and the surrounding air area in blue.
When simulating fluid flow around the PDC device, turbulence will form below the device. The cause of the turbulence is the model's geometry and fluid flow conditions as mentioned in [Flores-Castillo, 2022]. See the Flow Regime subsection for a more theoretical explanation.
To avoid the formation of turbulence below the PDC, a solid region (in red) was added beneath the PDC device, whose primary function is to prevent turbulence from forming beneath the PDC [Flores-Castillo, 2022]. A further step to prevent turbulence from developing is by placing the PDC right corner at the right boundary of the air domain, as shown in the figure below.

Modified domain of analysis Ω conformed by the PDC device in gray, a solid region in red and the surrounding air area in blue.
The PDC device has a length ![]() of 1
of 1 ![]() and a thickness
and a thickness ![]() of 0.0253
of 0.0253 ![]() . The PDC thickness is divided by 10% of condenser,
. The PDC thickness is divided by 10% of condenser, ![]() , and the rest of insulator,
, and the rest of insulator, ![]() . Moreover, the PDC is tilted, with an angle of 30° from the horizontal.
. Moreover, the PDC is tilted, with an angle of 30° from the horizontal.

Dimensions of the PDC device. The condenser in white and the insulator in gray.
The PDC region is specified as a rectangle that is orthogonal to the axis. Then, through geometric transformation, the rectangle will be centered at {PDCcenterX,PDCcenterZ} and rotated 30° from the horizontal.
In order to geometrically transform the coordinates RotationTransform and TranslationTransform are used.
The grey rectangle is the insulator, and the one with the red dot is the translated and rotated one. The same rotation and translation applies to the condenser, which can be seen as a small black line at the top of the insulator. The condenser is very small compared to the insulator.
Mesh Generation
The boundary mesh is created using ToBoundaryMesh. In addition to the coordinates of the PDC, a solid region is defined to avoid simulating the turbulent flow below the PDC. The new solid region is a triangle, placed beneath the PDC device. Two of the triangle coordinates are the two bottom coordinates of the insulator, while the third coordinate is at a specific height ![]() at the right boundary of the domain.
at the right boundary of the domain.
The area above the PDC is of great importance. In that area, the differential temperature ![]() for the heat transfer coefficient
for the heat transfer coefficient ![]() computation (Eqn. 12) will be obtained. To get an accurate result, a finer mesh will be used in that specific area. The mesh refinement function used for refining the area is given by a semicircle strictly above the PDC surface.
computation (Eqn. 12) will be obtained. To get an accurate result, a finer mesh will be used in that specific area. The mesh refinement function used for refining the area is given by a semicircle strictly above the PDC surface.
The above defines a mesh refinement function that produces the mesh elements of an area less than 0.00005 units when inside the refinement region and less than 0.0001 units when outside. Now the full element mesh can be generated.
Material Parameters
The fluid medium is air and material properties are set up next.
Velocity Functions
This section computes the velocity field around the PDC, based on inflow wind speeds obtained from weather stations nearby. The wind speeds are on the order of ![]()
![]() . Using them directly will result in an unnecessarily long runtime of NDSolve, mainly because the high velocities increase the dynamics of the PDE, and NDSolve, or any other FEM solver for that matter, needs to take smaller time steps to time-integrate the PDE.
. Using them directly will result in an unnecessarily long runtime of NDSolve, mainly because the high velocities increase the dynamics of the PDE, and NDSolve, or any other FEM solver for that matter, needs to take smaller time steps to time-integrate the PDE.
To avoid this, the following approach is used: The Navier–Stokes equation is solved for lower inflow velocities, around ![]()
![]() , and solved up to a time of
, and solved up to a time of ![]() . Then, the velocity field is extrapolated beyond the velocity field calculated at
. Then, the velocity field is extrapolated beyond the velocity field calculated at ![]() . This is justified, given that the flow regime over the PDC surface is laminar. The approach assumes that the velocity field increases linearly as the incoming velocity increases. This approach is validated in [Flores-Castillo, 2022] and will be explained and done after solving the fluid model as an additional post-processing step.
. This is justified, given that the flow regime over the PDC surface is laminar. The approach assumes that the velocity field increases linearly as the incoming velocity increases. This approach is validated in [Flores-Castillo, 2022] and will be explained and done after solving the fluid model as an additional post-processing step.
For the inflow boundary condition to be consistent with the initial conditions, a helper function ![]() that smoothly ramps up the inflow over time is created. The smoothed step function is defined as follows:
that smoothly ramps up the inflow over time is created. The smoothed step function is defined as follows:
Here the minimum value and the maximum value the function ![]() can reach are denoted by
can reach are denoted by ![]() and
and ![]() . The location of the step is controlled by
. The location of the step is controlled by ![]() , and the smoothed steepness is controlled by
, and the smoothed steepness is controlled by ![]() .
.
The parameters chosen for the ramp-function are taken from [Flores-Castillo, 2022].
The next step is to generate an incoming wind velocity profile along the ![]() axis. The velocity profile will follow the classical logarithmic variation given in equation (13):
axis. The velocity profile will follow the classical logarithmic variation given in equation (13):
As the PDC is not exactly on the ground, the velocity profile is shifted by ![]() in the
in the ![]() direction.
direction.
Our velocity at ![]() is going to have a lower value than the existing meteorological wind velocity at 10
is going to have a lower value than the existing meteorological wind velocity at 10 ![]() . Remember that the velocity is solved for smaller inflow velocities.
. Remember that the velocity is solved for smaller inflow velocities.
The value of 0.35 was chosen due to its effects on increasing the convergence of the simulation. Different values were tested using this same model, but the value of 0.35 was the best [Flores-Castillo, 2022].
Flow Regime
The value of the Reynolds number hints at if a flow is laminar or turbulent and is calculated as:
where ![]() is the density of the fluid,
is the density of the fluid, ![]() is the viscosity,
is the viscosity, ![]() is the average velocity, and
is the average velocity, and ![]() is the characteristic length.
is the characteristic length.
It is always advisable to calculate the Reynolds ![]() number before doing a fluid flow simulation, so one can determine the type of the flow. For an open planar structure, turbulence for air occurs for
number before doing a fluid flow simulation, so one can determine the type of the flow. For an open planar structure, turbulence for air occurs for ![]() , corresponding to wind velocities
, corresponding to wind velocities ![]() with
with ![]() , meaning that most air flows surrounding PDC devices should correspond to laminar flows [Beysens, 2018]. Nevertheless, this is a theoretical concept, and small inhomogeneities in the PDC geometry can make the flow turbulent at much smaller values of
, meaning that most air flows surrounding PDC devices should correspond to laminar flows [Beysens, 2018]. Nevertheless, this is a theoretical concept, and small inhomogeneities in the PDC geometry can make the flow turbulent at much smaller values of ![]() . For this reason, the model has a solid region beneath the PDC, just to prevent turbulence from forming in the simulation.
. For this reason, the model has a solid region beneath the PDC, just to prevent turbulence from forming in the simulation.
In this model, the average velocity is given by the velocity profile at ![]() , the
, the ![]() coordinate of
coordinate of ![]() , and the characteristic length is taken as the length of the PDC:
, and the characteristic length is taken as the length of the PDC: ![]() .
.
This value indicates that theoretically, the flow is in the laminar regime.
Boundary Conditions
There are four types of boundary conditions involved in the fluid dynamics model:
At the inlet, the flow velocity is set to ![]() , where
, where ![]() is the velocity profile.
is the velocity profile.
The ground level of the domain is represented as a wall and also the exterior boundaries of the PDC device, so the flow velocity is set to zero on the boundaries to model a no-slip flow condition.
The no-slip condition specified at the walls of the PDC device is used to fulfil the condition that the velocities on the surface need to be 0. A 0 velocity on the boundary is essential for the computation of the heat transfer coefficient ![]() as outlined in the condensation model section.
as outlined in the condensation model section.
At the outlet, a pressure outlet boundary condition is used to model the outgoing flow. Here, the outlet pressure is set to an absolute pressure of ![]() ,
, ![]() , equivalent to a relative pressure of
, equivalent to a relative pressure of ![]() .
.
At the top of the domain, an open boundary condition is applied. An open boundary condition describes a boundary in which the fluidic section of the geometry ends, but which is in contact with the rest of the fluid domain that is not represented in the geometry. This boundary condition is modeled as a Neumann 0 value. As these are the natural default boundary conditions, these can be left out.
Solve the PDE Model
First, the fluid dynamics PDE is solved for the flow velocity field ![]() .
.
Since the Navier–Stokes equation is a high-index differential algebraic equation, options are specified to time-integrate the equations efficiently. The maximum difference order of the time integrator is reduced to minimize the number of rejected steps. The time-dependent boundary conditions are differentiated to create a consistent system of equations that are more efficient to time-integrate. Last, a stable solution can be found if the velocities are interpolated with a higher order than the pressure. Here the velocities ![]() and
and ![]() are set to be interpolated with second order and the pressure
are set to be interpolated with second order and the pressure ![]() with first order.
with first order.
To read more about the set of options NDSolve has for finite elements and how to specify them, check the following tutorial, NDSolve Options for Finite Elements.
Also, NDSolve is instructed to use the multifrontal algorithm as a linear solver instead of the default. In this case, the default linear solver cannot solve the nearly singular matrices given. If the default is used, the following message will appear:
To inspect the fluid field, the following visualizations show a stream plot of the velocity field ![]() and a contour plot for the velocity magnitude with
and a contour plot for the velocity magnitude with ![]() .
.
The extrapolation of the velocity field is done in the following subsection.
Extrapolation Method
The Navier–Stokes equation was solved for low inflow velocities, around ![]() , and solved up to a time of
, and solved up to a time of ![]() . However, a solution that can covers the whole period of the heat transfer simulation is required, which is approximately
. However, a solution that can covers the whole period of the heat transfer simulation is required, which is approximately ![]() hours or
hours or ![]() . Also, real wind velocity values need to be considered. To accomplish that, the velocity field previously obtained is extrapolated to match the actual wind velocities at all times. The wind velocity function
. Also, real wind velocity values need to be considered. To accomplish that, the velocity field previously obtained is extrapolated to match the actual wind velocities at all times. The wind velocity function ![]() already obtained here will be used to know when is it necessary to modify the velocity values.
already obtained here will be used to know when is it necessary to modify the velocity values.
To understand how the extrapolation works, it is instructive to look at a hypothetical ![]() case. Assuming the wind velocity at
case. Assuming the wind velocity at ![]() above ground
above ground ![]() is
is ![]() , this is then compared to the meteorological field velocity
, this is then compared to the meteorological field velocity ![]() at
at ![]() , which is
, which is ![]() . If the wind speed is higher than
. If the wind speed is higher than ![]() , as it is in this case, the solution field from the Navier–Stokes solution at
, as it is in this case, the solution field from the Navier–Stokes solution at ![]() will be multiplied by the factor
will be multiplied by the factor ![]() , and that new velocity field will be the field for
, and that new velocity field will be the field for ![]() . If the velocity is less than
. If the velocity is less than ![]() in the given case, then the velocity field for
in the given case, then the velocity field for ![]() will be taken directly from the Navier–Stokes solution at a specific
will be taken directly from the Navier–Stokes solution at a specific ![]() . One can say for now that it takes the solution at
. One can say for now that it takes the solution at ![]() , because the velocity field from the Navier–Stokes equation at this time step already reassembles the wind speed magnitudes at
, because the velocity field from the Navier–Stokes equation at this time step already reassembles the wind speed magnitudes at ![]() .
.
The solution field was solved until ![]() , so in the case that the velocity is less than
, so in the case that the velocity is less than ![]() , it will be necessary to develop a way in which, for times larger than
, it will be necessary to develop a way in which, for times larger than ![]() , the solution from the Navier–Stokes equation can still be made use of. To fix this time inconsistency, two functions are developed that will help to accomplish that.
, the solution from the Navier–Stokes equation can still be made use of. To fix this time inconsistency, two functions are developed that will help to accomplish that.
The first function receives as input the ratio between ![]() and the wind speed data
and the wind speed data ![]() , and as output gives a time that lies within the range of the fluid simulation. This function aims to know which time velocity solution to use for longer times, i.e., for a time of
, and as output gives a time that lies within the range of the fluid simulation. This function aims to know which time velocity solution to use for longer times, i.e., for a time of ![]() ; the function says that the velocity solution at
; the function says that the velocity solution at ![]() can be used.
can be used.
The times that will be obtained come from solving the following equation:
where ![]() is the same ramp up function used in the fluid simulation and
is the same ramp up function used in the fluid simulation and ![]() is a constant value.
is a constant value.
The ramp up function is the function to solve for ![]() , and the value
, and the value ![]() is going to be
is going to be ![]() or the ratio
or the ratio ![]() given as an input. The value of
given as an input. The value of ![]() also is the threshold value that will determine the value of
also is the threshold value that will determine the value of ![]() and, consequently, the return time value.
and, consequently, the return time value.
Note that Solve always returns a nested list of rules. To use the solution, the rule must be replaced and then the value extracted from the list.
So, the function compares the input ratio ![]() and
and ![]() . If the velocity ratio is greater than or equal to 0.98, the ramp up will be solved for
. If the velocity ratio is greater than or equal to 0.98, the ramp up will be solved for ![]() given
given ![]() . If the condition is not satisfied, the ramp up function will be solved for
. If the condition is not satisfied, the ramp up function will be solved for ![]() given
given ![]() .
.
As the condition is true, the return time value will be ![]() ; otherwise, it will be a lower time value that depends on the ratio of velocities.
; otherwise, it will be a lower time value that depends on the ratio of velocities.
After defining this function, an interpolating function is created that will relate the fluid simulation to the heat transfer simulation times. The ![]() values will range from 0 to
values will range from 0 to ![]() , and the
, and the ![]() values will be from
values will be from ![]() to
to ![]() . This function will allow you to extract the solution for times longer than
. This function will allow you to extract the solution for times longer than ![]() , regardless of the time domain of the heat transfer solution.
, regardless of the time domain of the heat transfer solution.
This provides a way to access the Navier–Stokes solution; next, the implementation of the extrapolation needs to be taken care of.
The implementation uses If conditional statements to compare when the wind velocity is above or below ![]() . Suppose the wind velocity at time
. Suppose the wind velocity at time ![]() is lower than the velocity at
is lower than the velocity at ![]() (
(![]() ), then the velocity field at time
), then the velocity field at time ![]() will be from the Navier–Stokes solution without any modification. If not, the velocity field at time
will be from the Navier–Stokes solution without any modification. If not, the velocity field at time ![]() is multiplied by the ratio between the wind speed
is multiplied by the ratio between the wind speed ![]() at time
at time ![]() and the velocity at
and the velocity at ![]() ,
, ![]() .
.
where ![]() ranges from
ranges from ![]() to
to ![]() and time is a function timeFunction that returns a time value between
and time is a function timeFunction that returns a time value between ![]() and
and ![]() .
.
The velocity ![]() from Eqn. 14 will look as follows:
from Eqn. 14 will look as follows:
Finally, to define the velocity functions, it needs to be considered that the heat transfer model will use a different mesh that includes the PDC region. The PDC device should have no velocity field assigned to it, as it is solid. For this purpose, an element marker, to be defined later, is used in the following functions to assign a velocity of zero inside the PDC.
Heat Transfer Model Setup
Overview
In this section, the heat transfer model will be discussed and set up, including equations, domain of analysis, material parameters and boundary conditions.
The heat equation will be active in both the fluid region and the PDC device. For a transient heat transfer model, the temperature distribution ![]() is described by the transient heat equation. The transient heat equation is given by:
is described by the transient heat equation. The transient heat equation is given by:
What follows is just the general heat equation and is not what is used in the simulation. The parameters will be specified in the Heat Transfer Parameter Specification subsection.
Besides the heat transfer PDE model, it is necessary to specify boundary conditions:
- The convective term
 models the air flow velocity over the device and removes thermal energy from the PDC.
- Radiation
 models in- and outflow of thermal energy of the PDC with the surroundings through radiation.
- The condensation process
 , considered as incoming heat flux, also affects the temperature of the device.
- The solar irradiance
 , considered as incoming heat flux, also affects the temperature of the device.
In summary, the heat transfer model will simulate the temperature distribution of the fluid and, on the other hand, the temperature distribution of the condenser and insulator, taking into account various boundary conditions.
One should notice that this setup does not consider a support structure for the PDC device itself. It is assumed that the condensing surface is fixed on an adiabatic material [Beysens, 2018], which makes a simulation of a mount unnecessary.
From here, meteorological data is used throughout the whole simulation.
Mesh Generation
In this subsection, the mesh element number is reduced by increasing the mesh element size, and this mesh now includes the PDC region not considered in the fluid simulation. The red solid triangle region has also been removed as in the fluid simulation. This area is of no interest for the simulation, and removing this area does not change the heat equation solution [Flores-Castillo, 2022].
As was discussed before, the domain is composed of different materials that have their own properties. To do this, markers are assigned to the different subregions. These markers are used to set up the material parameters. Using markers for this is much simpler than specifying the formula for each subregion.
For markers to be attributed to different subregions, coordinates that lie in those subregions need to be specified.
The element markers are going to be: "Air"->10, "Condenser"->20 and "Insulator"->30.
When specifying different subregions it is also possible to refine each of them.
The mesh refinement focuses only on the interface between the PDC surface and the air, as can be seen in the mesh from above.
The blue region represents the air, gray the insulator and white the condenser. There is no need to refine the condenser surface. What is of interest is the interface between the condenser surface and the air, and the region above it.
Heat Transfer Parameter Specification
Next, material properties need to be specified for each subregion. The fluid medium is air. The condenser is made of low-density polyethylene (LDPE) and the insulator of Styrofoam.
Then, specify the velocities that were defined in the Extrapolation Method subsection.
Boundary Conditions
Besides the heat transfer PDE model, it is necessary to specify boundary conditions:
- The convective term
 models the air flow velocity over the device and removes thermal energy from the PDC.
- Radiation
 models in- and outflow of thermal energy of the PDC with the surroundings through radiation.
- The condensation process
 , considered as incoming heat flux, also affects the temperature of the device.
- The solar irradiance
 , considered as incoming heat flux, also affects the temperature of the device.
Next, the boundary condition terms of the heat transfer model are quantified. The following abbreviations are used: ![]() for ambient,
for ambient, ![]() for condenser and
for condenser and ![]() for sky. These boundary conditions are applied on inner boundaries and not on the simulation domain boundary.
for sky. These boundary conditions are applied on inner boundaries and not on the simulation domain boundary.
Convection term
Due to the no-slip fluid condition specified at the walls of the PDC device, the velocities on the surface are 0. So a convective boundary condition cannot be directly used in the heat transfer model. Nevertheless, the heat transfer coefficient ![]() is computed, which is necessary for calculating the amount of water, as outlined in the condensation model section. This process ensures that the convective contribution is taken into account.
is computed, which is necessary for calculating the amount of water, as outlined in the condensation model section. This process ensures that the convective contribution is taken into account.
Condensation term
In the serial approach, the temperature of the PDC does not use the condensation term ![]() , so this boundary condition is not used.
, so this boundary condition is not used.
Radiation term
![]() is the radiative cooling term, expressed as the difference between absorbed radiation from the sky and the radiation emitted by the condenser, and it is expressed with the following equation [Flores-Castillo, 2022]:
is the radiative cooling term, expressed as the difference between absorbed radiation from the sky and the radiation emitted by the condenser, and it is expressed with the following equation [Flores-Castillo, 2022]:
where ![]() is the emissivity of the sky,
is the emissivity of the sky, ![]() is the emissivity of the condenser,
is the emissivity of the condenser, ![]() is the Stefan–Boltzmann constant and
is the Stefan–Boltzmann constant and ![]() is a view factor that ranges from 0 to 1.
is a view factor that ranges from 0 to 1.
![]() can be simplified further by considering that the sky temperature
can be simplified further by considering that the sky temperature ![]() is related to the ambient temperature
is related to the ambient temperature ![]() according to equation (15):
according to equation (15):
Substituting equation (16) into (17) gives:
The boundary condition expressed in equation (18) given in [Flores-Castillo, 2022] is not conventional, in the sense that it does not directly map to the typically used HeatRadiationValue. Nevertheless, the given boundary condition can be implemented. The radiative cooling model given here does not consider the condenser surface absorptivity factor α, typically used when expressing the incoming radiation. More details can be found in Thermal Radiation Boundary Conditions or in [Beysens, 2018, equation 7.20], where a more common form of the equation is shown that can be modeled with HeatRadiationValue.
In this subsection, the radiation term ![]() will be further refined. Instead of using the above equation, now cloud cover fraction
will be further refined. Instead of using the above equation, now cloud cover fraction ![]() effects on the sky temperature
effects on the sky temperature ![]() are also considered, turning
are also considered, turning ![]() into
into ![]() .
.
For this boundary, the following variables are used: the sky temperature with cloud coverage ![]() , emissivity
, emissivity ![]() , the Stefan–Boltzmann constant
, the Stefan–Boltzmann constant ![]() and a view factor
and a view factor ![]() that is dependent on the tilt angle of the PDC.
that is dependent on the tilt angle of the PDC.
To get a value for the view factor ![]() , Planck's law is used. Planck's law describes the spectral radiance
, Planck's law is used. Planck's law describes the spectral radiance ![]() and provides the power radiated by a surface element at different wavelength
and provides the power radiated by a surface element at different wavelength ![]() . The power is measured per unit surface area of the body, per unit solid angle
. The power is measured per unit surface area of the body, per unit solid angle ![]() and per unit wavelength [Beysens, 2018]. The Planck radiation law is the following one:
and per unit wavelength [Beysens, 2018]. The Planck radiation law is the following one:
PlanckRadiationLaw is used for further calculations. PlanckRadiationLaw uses the same formula as equation (19).
When the spectral radiance ![]() is integrated over all the wavelengths and solid angles at a given temperature, one obtains the total blackbody spectral radiance:
is integrated over all the wavelengths and solid angles at a given temperature, one obtains the total blackbody spectral radiance:
Here ![]() is integrated over a half-sphere and
is integrated over a half-sphere and ![]() is integrated from
is integrated from ![]() to
to ![]() . The cosine appears because blackbodies obey Lambert's cosine law. In this equation,
. The cosine appears because blackbodies obey Lambert's cosine law. In this equation, ![]() represents the zenith angle (
represents the zenith angle (![]() ) and
) and ![]() the azimuthal angle (
the azimuthal angle (![]() ).
).
The part of the integral that involves ![]() is computed with PlanckRadiationLaw, while the rest is computed manually using symbolic integration.
is computed with PlanckRadiationLaw, while the rest is computed manually using symbolic integration.
When the PDC is inclined, the solid angle is not integrated over the whole sky; instead, the calculation is divided into two integrals. In the first integral, ![]() spans from 0 to
spans from 0 to ![]() and
and ![]() from 0 to
from 0 to ![]() , while in the second integral, what changes is the range of
, while in the second integral, what changes is the range of ![]() , which is now from
, which is now from ![]() (the tilt angle) to
(the tilt angle) to ![]() :
:
The view factor of the PDC tilted at a specific angle is given by the ratio between ![]() and
and ![]() .
.
As was mentioned before, radiative cooling is the essential thermal process for which it is possible to collect water, and the emissivity of the device ![]() plays a crucial role in how much energy is radiated from the PDC. The surface emissivity can depend on several factors, like temperature, wavelength, angle and other variables. Here, a constant emissivity is used to simplify the model.
plays a crucial role in how much energy is radiated from the PDC. The surface emissivity can depend on several factors, like temperature, wavelength, angle and other variables. Here, a constant emissivity is used to simplify the model.
It is important to realize that the value of cooling power ![]() is very sensitive to the value of the condenser emissivity
is very sensitive to the value of the condenser emissivity ![]() . So, one can adjust the emissivity values in the simulation to fit the data of a reference experiment [Beysens, 2018].
. So, one can adjust the emissivity values in the simulation to fit the data of a reference experiment [Beysens, 2018].
In this model, two different emissivities are used, depending on the situation of the condenser. If there is water on the condenser, the emissivity of water ![]() is used; otherwise, emissivity of the condenser
is used; otherwise, emissivity of the condenser ![]() is used. In this specific case, the same values are used for both emissivities. These values must always be in the range between zero and one.
is used. In this specific case, the same values are used for both emissivities. These values must always be in the range between zero and one.
An If conditional is used in the definition of ![]() to know when the surface temperature is below the dew point temperature and thus select between
to know when the surface temperature is below the dew point temperature and thus select between ![]() and
and ![]() . Remember that for dew to form on a surface, the surface must have a temperature below the dew point temperature
. Remember that for dew to form on a surface, the surface must have a temperature below the dew point temperature ![]() .
.
The solar irradiance heat flux ![]() and thermal radiation
and thermal radiation ![]() both happen at the condenser's surface.
both happen at the condenser's surface.
The condenser surface is specified with the help of a line ![]() . The line
. The line ![]() will give the
will give the ![]() coordinates of the surface. To create this line that overlaps the condenser surface, a function is defined that uses the equation of a line
coordinates of the surface. To create this line that overlaps the condenser surface, a function is defined that uses the equation of a line ![]() , where
, where ![]() is the slope of the line and
is the slope of the line and ![]() is the intersection with the
is the intersection with the ![]() axis.
axis.
The inputs for ![]() are defined below.
are defined below.
The thermal radiation boundary condition cannot be implemented with HeatRadiationValue, as ![]() does not directly map to what HeatRadiationValue uses. For this reason, a NeumannValue is set up.
does not directly map to what HeatRadiationValue uses. For this reason, a NeumannValue is set up.
Solar irradiance
Another heat contribution to the condenser is the solar irradiance ![]() . Solar radiation causes the condenser temperature to rise or decrease depending on the time of day. A simple solar radiation model [Wilkerson et al., 2013] was adapted for this model. This solar radiation model allows for predicting how much heat flux comes from the Sun, considering sunset and sunrise times for any location on Earth. Later on, it will be implemented as a Neumann boundary condition.
. Solar radiation causes the condenser temperature to rise or decrease depending on the time of day. A simple solar radiation model [Wilkerson et al., 2013] was adapted for this model. This solar radiation model allows for predicting how much heat flux comes from the Sun, considering sunset and sunrise times for any location on Earth. Later on, it will be implemented as a Neumann boundary condition.
First, the Earth's axis of rotation is defined, represented as a rotation matrix, where the rotation angle will be the tilt angle of the Earth, which is ![]() .
.
The following two equations give the Earth's rotation. The first one is again a rotation matrix, with an angle of rotation given by ![]() , which depends on the time of day and the year's season.
, which depends on the time of day and the year's season.
The total hours are given in seconds, starting at zero at midday [Flores-Castillo, 2022].
The season is the number of days from January 1 to the end date, divided by ![]() .
.
The position of the Earth to the Wun throughout the year is defined in the following function.
Next, the location on Earth is defined also as a vector .
One can obtain the vector normal to the surface from the two rotation matrices and the location vector.
Finally, the incident radiation is calculated from the angle of incidence times a maximum solar irradiance of 1360 ![]() .
.
The solar irradiance was adjusted to fit the experimental data available. The adjustment is made during the initial hour so the sunset and sunrise times of the simulation can match with the real ones [Flores-Castillo, 2022].
The solar irradiance plot shows that sunset and sunrise occur approximately at ![]() and
and ![]() , respectively. Notice that the solar irradiance goes to zero at night.
, respectively. Notice that the solar irradiance goes to zero at night.
To visualize the accumulated solar irradiance during the period, a list of points from the solar irradiance function needs to be created. Then Accumulate is used to get the total solar irradiation.
The heat flux boundary condition will represent the amount of thermal energy from the Sun flowing into the PDC surface.
Here, the "HeatConvectionVelocity" entry was removed because this boundary condition is for the PDC surface, which is a solid. If the heat convection velocities are included, the HeatFluxValue will be modeling a boundary of a fluid that includes a convection velocity term associated with the boundary unit normal ![]() , which is not wanted here.
, which is not wanted here.
Inlet temperature
This the only boundary condition that is applied to the simulation domain boundary.
At the flow inlet ![]() , the temperature is set to the ambient temperature
, the temperature is set to the ambient temperature ![]() .
.
Solution and Visualization
In this subsection, the heat equation will be solved. First, the initial condition is defined to denote an ambient temperature at ![]() over all the domain, then the PDE is set up.
over all the domain, then the PDE is set up.
Also, in this model, options are specified to time-integrate the equation. A MaxStepSize of 900 and a StartingStepSize of 1 were chosen. The time-integration method used is the "IDA" method with a maximum difference order of 1, set up through the "TimeIntegration" option. Finally, the time-dependent boundary conditions are differentiated to create a consistent system of equations that are more efficient to time-integrate. To read more about the set of options NDSolve has for finite elements and how to specify them, check the following tutorial, NDSolve Options for Finite Elements.
The previous warning message is generated due to the nature of the model and the mesh used. It does not affect the results of the model.
The plot from above shows the temperature of the condenser surface and the air temperature above the condenser. Both temperatures are essential for calculating the heat transfer coefficient ![]() and consequently, the amount of condensed water
and consequently, the amount of condensed water ![]() .
.
Condensation Model
Overview
The condensation model is based on the supersaturation equation (20):
In this equation, two processes are shown: condensation and evaporation. If the value of ![]() is positive, then condensation is taking place and
is positive, then condensation is taking place and ![]() . For a negative value of
. For a negative value of ![]() , evaporation is taking place. Since evaporation is not considered in the model, the rate of mass change will be set to zero
, evaporation is taking place. Since evaporation is not considered in the model, the rate of mass change will be set to zero ![]() .
.
Zero here means that the evaporation of the mass of water is not considered [Flores-Castillo, 2022]. So all water condensed is collected and the equation can be simplified to:
Another way of looking at equation (21) is as an integral:
This integral allows for computing the mass of the condensed water. With the exception of the heat transfer coefficient ![]() , the values in equation (22) can directly be obtained from formulas that will be shown later. At this stage, the computation of the heat transfer coefficient
, the values in equation (22) can directly be obtained from formulas that will be shown later. At this stage, the computation of the heat transfer coefficient ![]() needs some further explanation.
needs some further explanation.
It is essential to understand that the calculation of heat transfer coefficient ![]() is based on two assumptions: the flow over the PDC is laminar, and the flow velocity on the surface is 0.
is based on two assumptions: the flow over the PDC is laminar, and the flow velocity on the surface is 0.
As explained in the heat equation derivation, a fluid can have conductive ![]() and convective
and convective ![]() components. The convective component is proportional to the fluid velocity
components. The convective component is proportional to the fluid velocity ![]() . Since the heat transfer coefficient
. Since the heat transfer coefficient ![]() is to be established right at the interface between the fluid and PDC surface, and because fluid flow velocity is set at that boundary to 0, the convective part of the fluid flow must be zero at the boundary. At the PDC surface, Fourier's law of heat conduction remains to be applied right at the wall.
is to be established right at the interface between the fluid and PDC surface, and because fluid flow velocity is set at that boundary to 0, the convective part of the fluid flow must be zero at the boundary. At the PDC surface, Fourier's law of heat conduction remains to be applied right at the wall.
At the boundary, Fourier's law of heat conduction can be equated with Newton's law of cooling:
where ![]() is the heat transfer coefficient,
is the heat transfer coefficient, ![]() is the ambient temperature, and
is the ambient temperature, and ![]() is the condenser temperature.
is the condenser temperature.
Equating ![]() gives the heat transfer coefficient
gives the heat transfer coefficient ![]() :
:
If the fluid flow is not laminar or the fluid flow velocity is not zero at the boundary, a different model for computing the heat transfer coefficient ![]() needs to be used.
needs to be used.
Knowing the heat transfer coefficient ![]() and the surface temperature of the condenser
and the surface temperature of the condenser ![]() , one is able to calculate the condensation rate
, one is able to calculate the condensation rate ![]() .
.
Note once more that this model assumes that all water condensed is collected and no water evaporates.
The serial approach can estimate the amount of condensed water but it will be overestimated, as the PDC surface temperature ![]() will be lower than if water condensation were present [Flores-Castillo, 2022].
will be lower than if water condensation were present [Flores-Castillo, 2022].
Water Generation without Latent Heat
The condensed water will be computed by first calculating the heat transfer coefficient using equation (23) and then integrating equation (24).
Heat transfer coefficient
To calculate the heat transfer coefficient, the temperature gradient ![]() needs to be computed in the normal direction to the PDC.
needs to be computed in the normal direction to the PDC.
The temperature gradient is approximated by getting the differences in temperatures and distances between the PDC surface and a line parallel to the surface:
For computing the gradient, the PDC surface is divided into 200 sections, and the temperature is taken at the plate directly from the solution. The second temperature is taken from a distance ![]() over a line parallel to the PDC surface [Flores-Castillo, 2022].
over a line parallel to the PDC surface [Flores-Castillo, 2022].
To create the parallel line and make the evaluations on it, a straight line equation and a new intersection to the ![]() axis that is dependent of the position
axis that is dependent of the position ![]() are used.
are used.
Then, a function is defined that is going to calculate the temperature evaluations at the parallel line normal to the surface, and a second function is going to get the difference in temperatures ![]() .
.
The final step is to generate an interpolating function of ![]() as a function of time and PDC position.
as a function of time and PDC position.
The same can be done for ![]() and
and ![]() .
.
One can use the function for a specific time or for a period of time of the simulation and then use the interpolating functions to visualize the behavior of the heat transfer coefficient and other variables.
First, the behavior of the heat transfer coefficient and temperature gradient are shown at ![]() .
.
From the plots, it can be seen that the functions are coarse; this can be improved by making the mesh finer or by filtering the data. The latter will be applied by using a GaussianFilter.
To obtain the full-time behavior of ![]() , different interpolating functions are created that represent different times. In this case, the calculation of
, different interpolating functions are created that represent different times. In this case, the calculation of ![]() will be every
will be every ![]() , and from these, a single interpolating function is created that depends on time and space.
, and from these, a single interpolating function is created that depends on time and space.
The time domain of the interpolating functions will be from ![]() to
to ![]() . The
. The ![]() time is omitted to avoid a division by zero.
time is omitted to avoid a division by zero.
This plot shows that left side of the surface, where the air touches first, has a higher heat transfer coefficient. This plot is helpful because it shows how some portions of the PDC surface condense more water based on the localized heat transfer coefficient [Flores-Castillo, 2022].
To know if the computed heat transfer coefficient is valid, it can be compared with a theoretical approximation, which follows the following equation:
where ![]() is a corrective factor,
is a corrective factor, ![]() is an empirical value, and
is an empirical value, and ![]() is the typical condenser length scale.
is the typical condenser length scale.
The velocity ![]() will be the wind speed above and near the plate [Beysens, 2018]. So wind speed at 1 m above ground is used.
will be the wind speed above and near the plate [Beysens, 2018]. So wind speed at 1 m above ground is used.
One can see that the heat transfer coefficient ranges from 0 to 5 ![]() .
.
Water condensation
Water condensation can be estimated by equation (25). Both pressures needed to solve the equation are calculated by the following formula:
where ![]() represents the vapor pressure and can be
represents the vapor pressure and can be ![]() or
or ![]() depending on
depending on ![]() , which represents the ambient temperature
, which represents the ambient temperature ![]() or the condenser temperature
or the condenser temperature ![]() .
.
For calculating the last unknown, the latent heat of evaporation ![]() , the following equation that applies for the temperature range of 248
, the following equation that applies for the temperature range of 248 ![]() to 313
to 313 ![]() is used:
is used:
Equation (26) can be simplified if the temperature range is from 273 ![]() to 290
to 290 ![]() :
:
Equation (26) will be used for the calculations. The input temperature must be given in ![]() and the output is given in
and the output is given in ![]() .
.
With these functions, ![]() can be calculated according to equation (27).
can be calculated according to equation (27).
In addition, the necessary temperature condition for dew formation is given: if the surface temperature ![]() is higher than or equal to the dew temperature
is higher than or equal to the dew temperature ![]() , the mass rate will be zero.
, the mass rate will be zero.
Note that the surface area ![]() is 1
is 1 ![]() and that the latent of evaporation
and that the latent of evaporation ![]() is multiplied by 1000 to get the SI unit
is multiplied by 1000 to get the SI unit ![]() .
.
Now, to better understand how the different variables behave, one can visualize them at different times.
The surface temperature plot shows that at ![]() , water accumulation will happen at
, water accumulation will happen at ![]() of the condenser surface, because this is where
of the condenser surface, because this is where ![]() is below the dew point
is below the dew point ![]() .
.
This plot shows that indeed water starts to accumulate where ![]() .
.
The most common rainfall measurement is the total rainfall depth during a given period and is usually expressed in millimeters ![]() , the height reached by the water within a container. To know how much volume of water was condensed then, the catchment area needs to be known. If the catchment area is 1
, the height reached by the water within a container. To know how much volume of water was condensed then, the catchment area needs to be known. If the catchment area is 1 ![]() , then 1
, then 1 ![]() is equivalent to 1
is equivalent to 1 ![]() . The condensation rate is measured in
. The condensation rate is measured in ![]() or
or ![]() .
.
approximations, explained in the following, are applied.
First, the equation is numerically integrated along the length of the PDC at time ![]() using NIntegrate. Then this result is multiplied by the time step used. For each time interval, a list of values is generated; at the end, Accumulate is used to get the total sum of condensed water.
using NIntegrate. Then this result is multiplied by the time step used. For each time interval, a list of values is generated; at the end, Accumulate is used to get the total sum of condensed water.
At the first time steps, NIntegrate will fail to converge because ![]() at these time values has a value of zero over the entire surface. NIntegrate will give an error message and it will return a value of zero for these time steps.
at these time values has a value of zero over the entire surface. NIntegrate will give an error message and it will return a value of zero for these time steps.
In the following computation, the message generated by NIntegrate will be quieted.
The plot shows that the calculated water condensation with no latent heat of condensation present is approximately 0.226 ![]() , equivalent to 226
, equivalent to 226 ![]() .
.
Although the condensation term ![]() was not used in the simulation, it can be calculated according to its equation:
was not used in the simulation, it can be calculated according to its equation:
where ![]() is the latent heat of condensation and
is the latent heat of condensation and ![]()
![]() is the mass rate of condensate water. The latent heat of condensation is the heat released by water when it transitions from gas to liquid phase.
is the mass rate of condensate water. The latent heat of condensation is the heat released by water when it transitions from gas to liquid phase.
Since ![]() is already calculated, all that remains is the latent heat of condensation
is already calculated, all that remains is the latent heat of condensation ![]() , which is computed using the following equation:
, which is computed using the following equation:
where the latent heat of condensation ![]() is the negative of the latent heat of evaporation
is the negative of the latent heat of evaporation ![]() .
.
The plot shows that heat is effectively released at the condenser surface due to condensation of water on the condenser surface with a maximum value of approximately ![]() at
at ![]() . Different amounts of heat will be released at different times.
. Different amounts of heat will be released at different times.
Verification
According to [Lekouch et al., 2012], the observed water condensation for Mirleft, Morocco, was 0.22 ![]() , equivalent to 220
, equivalent to 220 ![]() . In contrast, the calculated water condensation with no latent heat of condensation present is approximately 0.226
. In contrast, the calculated water condensation with no latent heat of condensation present is approximately 0.226 ![]() , equivalent to 226
, equivalent to 226 ![]() . Apart from comparing the water volume, one can compare the PDC surface temperature with experimental results from [Lekouch et al., 2012].
. Apart from comparing the water volume, one can compare the PDC surface temperature with experimental results from [Lekouch et al., 2012].
The surface temperature varies with respect to ![]() at the PDC surface. So three different surface temperatures are shown, each representing the temperature at a specific location: at the surface's left, right and center. Also, an average surface temperature is included in the plot.
at the PDC surface. So three different surface temperatures are shown, each representing the temperature at a specific location: at the surface's left, right and center. Also, an average surface temperature is included in the plot.
From this plot, the effect of the solar irradiance can be observed at the two extremes of the plot when the surface temperatures ![]() goes down and up steeply. These high surface temperatures are due to the solar irradiance, so it can be seen that only at night can water condensate on the PDC surface.
goes down and up steeply. These high surface temperatures are due to the solar irradiance, so it can be seen that only at night can water condensate on the PDC surface.
Another peculiarity that this graph shows is that the temperature on the left side of the surface is always higher than on the right; this is due to the fact that the heat transfer coefficient ![]() has a much higher value on the left side of the surface. Also the cloud coverage effect can be observed around
has a much higher value on the left side of the surface. Also the cloud coverage effect can be observed around ![]() , which is when the cloud coverage effect increases and therefore also the surface temperature
, which is when the cloud coverage effect increases and therefore also the surface temperature ![]() .
.
The surface temperature values of the region after ![]() are the ones that are closer to the observed experimental values [Flores-Castillo, 2022].
are the ones that are closer to the observed experimental values [Flores-Castillo, 2022].
Appendix
WeatherData is a built-in function that gives access to worldwide weather data. When given a time interval, the function will return a time series of the weather parameter. In locations where there is no weather station, one can use data from a nearby station as a reasonable estimation of the ambient conditions for any model.
A function will be defined to access data from different weather stations. WeatherData is returned as a times series, and it is necessary to convert these data points into a continuous function, an interpolating function. For missing data, a MissingDataMethod needs to be specified.
For this case, MissingDataMethod will use an interpolation of order 0 to fill missing data values. On the other hand, the interpolating functions will be generated by using Interpolation with an interpolation order of 2.
Weather data from stations
Here is an example of how the function WeatherParameter works. The location used is the nearest weather station to Mirleft, Morocco. The location is given as an ICAO code, which is a standardized weather station identifier.
WeatherData sometimes does not have the data for the time period defined. For example, only 21 hours from the original 23.75 hours were available:
Sometimes the parameters will not cover the same period. To fix this, the minimum length of the data is defined, which will be used for plotting variables and doing other computations.
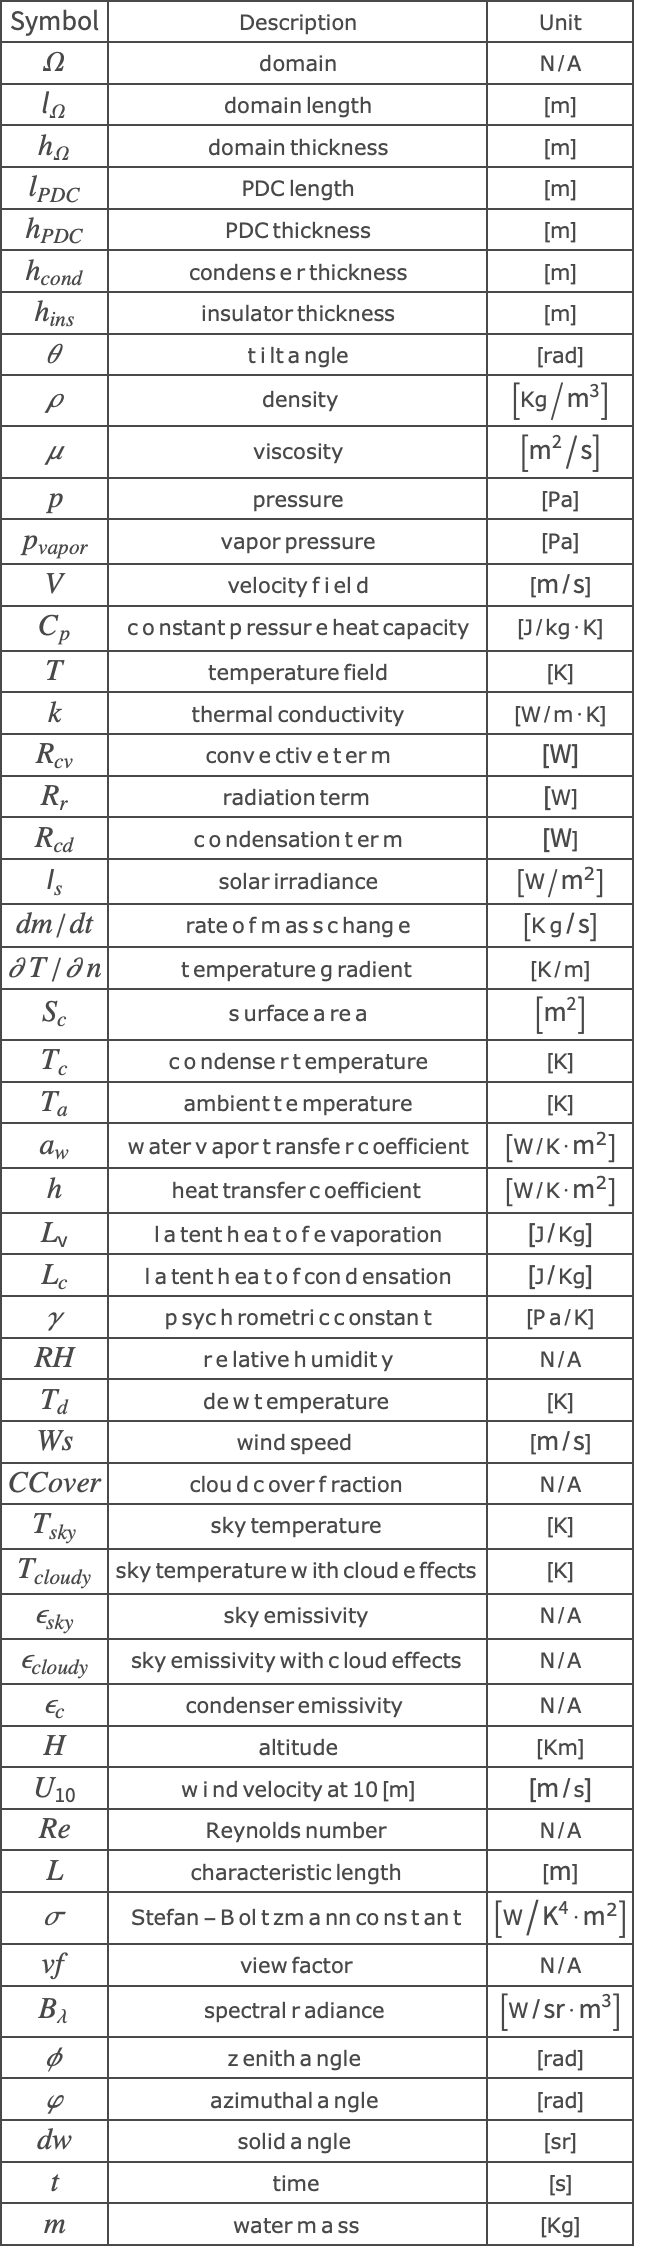
Nomenclature
References
1. Beysens, D. (2018). Dew Water. Aalborg: River Publishers.
2. Flores-Castillo, Pedro. (2022). "Computational Analysis of Water Condensation for Passive Dew Condensers to Optimize Water Condensation." Master's thesis, Harvard University Division of Continuing Education.
3. Gires, A. (2018) "How Do We Measure Rainfall?" Frontiers for Young Minds. 6:38. doi: 10.3389/frym.2018.00038
4. Lekouch, I., Lekouch, K., Muselli, M., Mongruel, A., Kabbachi, B. and Beysens, D. (2012). "Rooftop Dew, Fog and Rain Collection in Southwest Morocco and Predictive Dew Modeling Using Neural Networks." Journal of Hydrology (Amsterdam), Vol. 448–449, pp. 60–72. doi: 10.1016j.jhydrol.2012.04.004
5. Wilkerson, S., Wattenberg, F. A. and Park, R. (2013). "Solar Energy Incident on Earth's Surface." Wolfram Demonstrations Project. https://demonstrations.wolfram.com/SolarEnergyIncidentOnEarthsSurface