


BoundaryMeshRegion
BoundaryMeshRegion[{p1,p2,…},{bcell1[{i1,…}],bcell2[{j1,…}],…}]
yields a mesh with boundary cells bcellj, where coordinates given as integer i are taken to be pi, where the cells together represent a closed curve, surface, etc.
BoundaryMeshRegion[…,{…,wi[bcelli[…]],…}]
yields a mesh with cell properties defined by the symbolic wrapper wi.
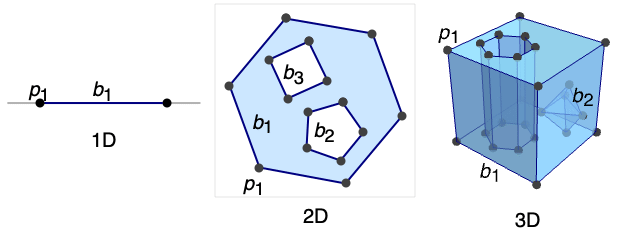
BoundaryMeshRegion[…,boundary1,boundary2,…]
yields a mesh from multiple boundaries boundaryi.
Details and Options
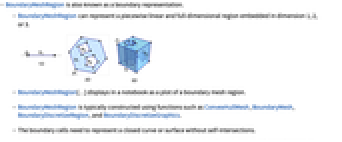
- BoundaryMeshRegion is also known as a boundary representation.
- BoundaryMeshRegion can represent a piecewise linear and full-dimensional region embedded in dimension 1, 2, or 3.
- BoundaryMeshRegion[…] displays in a notebook as a plot of a boundary mesh region.
- BoundaryMeshRegion is typically constructed using functions such as ConvexHullMesh, BoundaryMesh, BoundaryDiscretizeRegion, and BoundaryDiscretizeGraphics.
- The boundary cells need to represent a closed curve or surface without self-intersections.
- In BoundaryMeshRegion[{p1,p2,…},b1,b2,…], the boundary curves or surfaces bi should not cross themselves or each other.
- In BoundaryMeshRegion[{p1,p2,…},b1,b2,…], a point p is considered to be in the region enclosed by the boundary curves or surfaces bi if any infinite ray starting at p crosses the set of boundaries bi an odd number of times.
- The following special wrappers wi can be used for boundary faces:
-
Labeled[cell,…] display the cell with labeling Style[cell,…] show the cell with the specified style Annotation[cell,name->value] associate the annotation name->value with cell - Each cell in a BoundaryMeshRegion is given a unique MeshCellIndex of the form {d,i}, where d is the geometric dimension and i is the index.
- For purposes of selecting cells of a BoundaryMeshRegion, the following cell specifications may be used:
-
{d,i} cell with index i of dimension d {d,ispec} cells with index specification ispec of dimension d {dspec,…} cells of dimensions given by dspec h[{i1,…}] explicit cell with head h and vertex indices i1, … {c1,c2,…} list of explicit cells ci - The index specification ispec can have the following form:
-
i cell index i {i1,i2,…} cells with indices ik All all cells patt cells with indices matching the pattern patt - The dimension specification dspec can have the following form:
-
d explicit dimension d All all dimensions from 0 to geometric dimension of region patt dimensions matching the pattern patt - BoundaryMeshRegion contains cells of maximal dimension n-1, where n is the embedding dimension.
- BoundaryMeshRegion is always converted to an optimized representation and treated as raw by functions like AtomQ for purposes of pattern matching.
- BoundaryMeshRegion has the same options as Graphics for embedding dimension two, and the same options as Graphics3D for embedding dimension three, with the following additions and changes:
-
MeshCellLabel Automatic labels and placement for cells MeshCellShapeFunction Automatic shape functions for cells MeshCellStyle Automatic styles for cells MeshCellHighlight {} list of highlighted cells MeshCellMarker 0 integer markers for cells PlotTheme $PlotTheme overall theme for the mesh - Possible settings for PlotTheme include common base themes, font features themes, and size features themes.
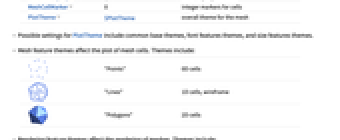
- Mesh feature themes affect the plot of mesh cells. Themes include:
-

"Points" 0D cells 
"Lines" 1D cells, wireframe 
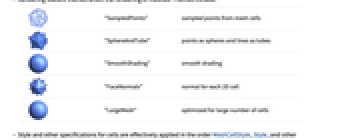
"Polygons" 2D cells - Rendering feature themes affect the rendering of meshes. Themes include:
-

"SampledPoints" sampled points from mesh cells 
"SphereAndTube" points as spheres and lines as tubes 
"SmoothShading" smooth shading 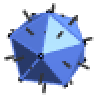
"FaceNormals" normal for each 2D cell 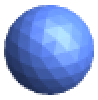
"LargeMesh" optimized for large number of cells - Style and other specifications for cells are effectively applied in the order MeshCellStyle, Style, and other wrappers, with later specifications overriding earlier ones.
- Label style and other specifications for cell labels are effectively applied in the order MeshCellLabel and Labeled, with later specifications overriding earlier ones.
- BoundaryMeshRegion can be used with functions such as RegionMember, RegionDistance, RegionMeasure, and NDSolve.
Examples
open all close allBasic Examples (5)
Scope (18)
Regions in 1D (4)
Specify an interval from its boundary points:
Label the points with HighlightMesh:
Specify a 1D region from multiple boundary points:
Apply Style to boundary points:
Regions in 2D (4)
Specify a triangle from its closed boundary curve:
Label the segments with HighlightMesh:
Specify a 2D region from multiple closed boundary curves:
Label the points with their corresponding indexes with HighlightMesh:
Apply Style to specific boundary lines:
Regions in 3D (4)
Specify a tetrahedron from its closed boundary surface:
Label the segments with HighlightMesh:
Specify a 3D region from multiple closed boundary surfaces:
Apply Style to specific boundary faces:
Options (127)
AlignmentPoint (1)
Specify the position to be aligned in 3D Inset, using ![]() coordinates:
coordinates:
AspectRatio (1)
Use numerical values for AspectRatio:
AxesEdge (2)
AxesStyle (2)
BaselinePosition (3)
Align the center of a graphic with the baseline of the text:
Specify the baseline of a graphic as a fraction of the height by using Scaled:
BoxRatios (2)
FaceGrids (4)
FrameLabel (2)
FrameTicks (3)
FrameTicksStyle (2)
GridLines (3)
ImageMargins (3)
Allow no margins outside of ImageSize:
ImagePadding (4)
ImageSize (3)
Lighting (4)
MeshCellHighlight (3)
MeshCellHighlight allows you to specify highlighting for parts of a BoundaryMeshRegion:
By making faces transparent, the internal structure of a 3D BoundaryMeshRegion can be seen:
MeshCellLabel (11)
MeshCellLabel can be used to label parts of a BoundaryMeshRegion:
MeshCellLabel can reveal a cell's index with "Index", "CellIndex", or "Cell":
Any expression can be used as a label:
Label all cells with tooltips:
All can be used to specify all cells:
By default, all cells are labeled:
Label all cells of a given dimension:
Label specific vertices and edges of a polygon:
Alternatively, you can specify a head and indices:
Specify a list of cell indices to label:
Label cells whose dimensions match a pattern:
MeshCellMarker (1)
MeshCellMarker can be used to assign values to parts of a BoundaryMeshRegion:
Use MeshCellLabel to show the markers:
MeshCellShapeFunction (2)
MeshCellShapeFunction allows you to specify functions for parts of a BoundaryMeshRegion:
MeshCellStyle (8)
All can be used to specify all cells:
By default, all cells are styled:
Style all cells of a given dimension:
Style specific vertices and edges of a polygon:
Alternatively, you can specify a head and indices:
Specify a list of cell indices to style:
Style cells whose dimensions match a pattern:
Style cells whose indices match a pattern:
Style with graphics directives appropriate for the dimension of the components:
PlotLabel (2)
Display a label on the top of the graphic in TraditionalForm:
Use Style and other typesetting functions to modify how the label appears:
PlotRange (3)
PlotRangeClipping (2)
PlotRangePadding (3)
Include ![]() coordinate unit of padding on all sides:
coordinate unit of padding on all sides:
Include padding using Scaled coordinates:
PlotRegion (3)
The contents of a graphic use the whole region:
Limit the contents of the graphic to the middle half of the region in each direction:
ImagePadding can also be used to add padding around a graphic:
PlotTheme (9)
Feature Themes (7)
Prolog (1)
RotateLabel (2)
SphericalRegion (2)
Make a sequence of images be consistently sized, independent of orientation:
Without SphericalRegion, each image is made as big as possible:
Ticks (3)
TicksStyle (2)
ViewPoint (3)
ViewRange (2)
Applications (6)
Polygons (2)
Non-intersecting polygons are also BoundaryMeshRegion:
The resulting regions can be used for computing:
The area approaches ![]() as the number of sides goes to infinity:
as the number of sides goes to infinity:
Build a BoundaryMeshRegion in 2D with multiple rectangular holes. The coordinates for the inner rectangles:
The indexes for the inner rectangle closed curves:
Generating an outer rectangle with ![]() ×
×![]() inner rectangle closed curves:
inner rectangle closed curves:
Polyhedra (4)
Non-intersecting polyhedra are also a BoundaryMeshRegion:
The Archimedean or semi-regular polyhedra:
Color the faces based on the number of vertices:
Color the faces of Archimedean polyhedra:
Build a BoundaryMeshRegion with multiple voids by using multiple inner cuboid boundaries. The coordinates for the inner cuboids:
The indexes for inner cuboid closed surfaces:
Generating an outer cuboid with ![]() ×
×![]() ×
×![]() inner cuboid surfaces:
inner cuboid surfaces:
The resulting region can be used for computing:
Construct a cuboid boundary mesh with rectangular tunnels through it. You can construct it as the product of a 2D boundary mesh with an interval. Using the same construction as for constructing the polygon with holes above for the 2D boundary mesh:
The resulting boundary representation for a polygon with ![]() ×
×![]() holes:
holes:
Compute the Cartesian product with an interval:
Properties & Relations (8)
BoundaryMeshRegion can represent full-dimensional regions:
Since the geometric dimension is the embedding dimension, it is full dimensional:
BoundaryMeshRegion is always bounded:
Use BoundedRegionQ to test and RegionBounds for actual bounds:
BoundaryMeshRegionQ can be used to test whether a region is a BoundaryMeshRegion:
Use ConvexHullMesh to create a BoundaryMeshRegion from a set of points:
Use BoundaryMesh to convert a MeshRegion to a BoundaryMeshRegion:
Only the full-dimensional component can be represented:
Use BoundaryDiscretizeRegion to convert any region to a BoundaryMeshRegion:
To include lower-dimensional components, use DiscretizeRegion:
Use Show to convert any BoundaryMeshRegion to Graphics:
BoundaryMeshRegion is usually more memory efficient than MeshRegion:
Text
Wolfram Research (2014), BoundaryMeshRegion, Wolfram Language function, https://reference.wolfram.com/language/ref/BoundaryMeshRegion.html (updated 2015).
CMS
Wolfram Language. 2014. "BoundaryMeshRegion." Wolfram Language & System Documentation Center. Wolfram Research. Last Modified 2015. https://reference.wolfram.com/language/ref/BoundaryMeshRegion.html.
APA
Wolfram Language. (2014). BoundaryMeshRegion. Wolfram Language & System Documentation Center. Retrieved from https://reference.wolfram.com/language/ref/BoundaryMeshRegion.html