ConoverTest[dspec,![]() ]
]
tests a dispersion measure against ![]() .
.
ConoverTest[dspec,![]() ,"property"]
,"property"]
returns the value of "property".


ConoverTest
ConoverTest[{data1,data2,…}]
tests whether the variances of data1, data2, … are equal.
ConoverTest[dspec,![]() ]
]
tests a dispersion measure against ![]() .
.
ConoverTest[dspec,![]() ,"property"]
,"property"]
returns the value of "property".
Details and Options
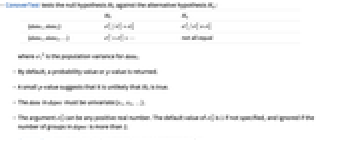
- ConoverTest tests the null hypothesis
 against the alternative hypothesis
  :
: -


{data1,data2} 

{data1,data2,…} 
not all equal - where σi2 is the population variance for datai.
- By default, a probability value or
 -value is returned.
 - A small
 -value suggests that it is unlikely that
  is true.
 - The data in dspec must be univariate {x1,x2,…}.
- The argument
 can be any positive real number. The default value of
  is 1 if not specified, and ignored if the number of groups in dspec is more than 2.
 - ConoverTest assumes the data is symmetric about a common median.
- ConoverTest[data,
 ,"HypothesisTestData"] returns a HypothesisTestData object htd that can be used to extract additional test results and properties using the form htd["property"].
 - ConoverTest[data,
 ,"property"] can be used to directly give the value of "property".
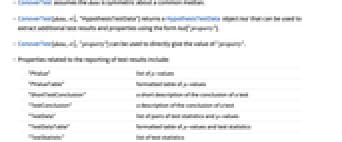
 - Properties related to the reporting of test results include:
-
"PValue" list of  -values
"PValueTable" formatted table of  -values
"ShortTestConclusion" a short description of the conclusion of a test "TestConclusion" a description of the conclusion of a test "TestData" list of pairs of test statistics and  -values
"TestDataTable" formatted table of  -values and test statistics
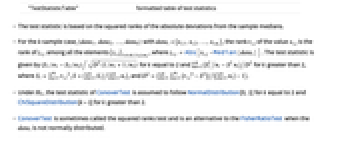
"TestStatistic" list of test statistics "TestStatisticTable" formatted table of test statistics - The test statistic is based on the squared ranks of the absolute deviations from the sample medians.
- For the
 -sample case,
  with datai={xi,1,xi,2,…,xi,ni}, the rank ri,j of the value xi,j is the rank of zi,j among all the elements {zi,j}1≤i≤k,1≤j≤ni, where zi,j=Abs[xi,j-Median[datai]]. The test statistic is given by
  for
for  equal to 2 and
  for
for  greater than 2, where
  ,
,  , and
, and  .
. - Under
 , the test statistic of ConoverTest is assumed to follow NormalDistribution[0,1] for
  equal to 2 and ChiSquareDistribution[k-1] for
  greater than 2.
 - ConoverTest is sometimes called the squared ranks test and is an alternative to the FisherRatioTest when the datai is not normally distributed.
- The following options can be used:
-
AlternativeHypothesis "Unequal" the inequality for the alternative hypothesis SignificanceLevel 0.05 cutoff for diagnostics and reporting VerifyTestAssumptions Automatic set which diagnostic tests to run - For the ConoverTest, a cutoff
 is chosen such that
  is rejected only if
  . The value of
  used for the "TestConclusion" and "ShortTestConclusion" properties is controlled by the SignificanceLevel option. This value
  is also used in diagnostic tests of assumptions, including tests for symmetry. By default,
  is set to 0.05.
 - Named settings for VerifyTestAssumptions in ConoverTest include:
-
"Symmetry" verify that all data is symmetric
Examples
open all close allBasic Examples (2)
Test variances from two populations for equality:
Create a HypothesisTestData object for further property extraction:
Test the ratio of the variances of two populations against a particular value:
Scope (8)
Testing (6)
Compare the variances of two populations:
The ![]() -value is uniformly distributed in [0,1] under
-value is uniformly distributed in [0,1] under ![]() :
:
The histogram of a sample of ![]() -values of the Conover test:
-values of the Conover test:
The ![]() -value is typically small when
-value is typically small when ![]() is false:
is false:
Test whether the ratio of the variances of two populations is a particular value:
The following forms are equivalent:
The order of the datasets should be considered when determining ![]() :
:
Test whether the variances of three populations are identical:
Create a HypothesisTestData object for repeated property extraction:
The properties available for extraction:
Extract some properties from a HypothesisTestData object:
The ![]() -value and test statistic:
-value and test statistic:
Options (6)
AlternativeHypothesis (3)
SignificanceLevel (1)
Applications (1)
Properties & Relations (8)
Under ![]() , the test statistic follows NormalDistribution[0,1] when the number of groups is 2:
, the test statistic follows NormalDistribution[0,1] when the number of groups is 2:
Under ![]() , the test statistic follows ChiSquareDistribution[k-1] when the number of groups is
, the test statistic follows ChiSquareDistribution[k-1] when the number of groups is ![]() with
with ![]() :
:
Unlike the FisherRatioTest, the Conover test does not assume normality:
The FisherRatioTest results in underestimation of ![]() -values:
-values:
The Conover test assumes the data is symmetric about a common median:
The distribution of the test statistic is not standard normal when the data is asymmetric:
The test statistic for the ConoverTest is rank-based:
With no ties, Ordering can be used to compute ranks:
The PearsonChiSquareTest is used to test data for symmetry about a common median:
The data is found to be symmetric and no warning is issued:
The ![]() -value in the warning matches that of the PearsonChiSquareTest:
-value in the warning matches that of the PearsonChiSquareTest:
The Conover test ignores the time stamps when the input is a TimeSeries:
The Conover test recognizes the path structure of a TemporalData:
Possible Issues (3)
The data should be symmetric about a common median:
The first two datasets are symmetric after accounting for a shift in location:
The last two datasets are not symmetric about their common median:
The Conover test ignores the argument ![]() when there are more than 2 groups:
when there are more than 2 groups:
When there are more than 2 groups in the data, the Conover test only allows the two-sided test for the alternative hypothesis:
Text
Wolfram Research (2010), ConoverTest, Wolfram Language function, https://reference.wolfram.com/language/ref/ConoverTest.html (updated 2017).
CMS
Wolfram Language. 2010. "ConoverTest." Wolfram Language & System Documentation Center. Wolfram Research. Last Modified 2017. https://reference.wolfram.com/language/ref/ConoverTest.html.
APA
Wolfram Language. (2010). ConoverTest. Wolfram Language & System Documentation Center. Retrieved from https://reference.wolfram.com/language/ref/ConoverTest.html