FisherRatioTest[dspec,![]() ]
]
tests a dispersion measure against ![]() .
.
FisherRatioTest[dspec,![]() ,"property"]
,"property"]
returns the value of "property".


FisherRatioTest
FisherRatioTest[data]
tests whether the variance of data is 1.
FisherRatioTest[{data1,data2}]
tests whether the variances of data1 and data2 are equal.
FisherRatioTest[dspec,![]() ]
]
tests a dispersion measure against ![]() .
.
FisherRatioTest[dspec,![]() ,"property"]
,"property"]
returns the value of "property".
Details and Options
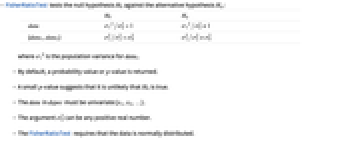
- FisherRatioTest tests the null hypothesis
 against the alternative hypothesis
  :
: -


data 

{data1,data2} 

- where σi2 is the population variance for datai.
- By default, a probability value or
 -value is returned.
 - A small
 -value suggests that it is unlikely that
  is true.
 - The data in dspec must be univariate {x1,x2,…}.
- The argument
 can be any positive real number.
 - The FisherRatioTest requires that the data is normally distributed.
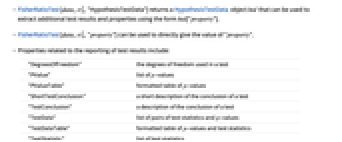
- FisherRatioTest[data,
 ,"HypothesisTestData"] returns a HypothesisTestData object htd that can be used to extract additional test results and properties using the form htd["property"].
 - FisherRatioTest[data,
 ,"property"] can be used to directly give the value of "property".
 - Properties related to the reporting of test results include:
-
"DegreesOfFreedom" the degrees of freedom used in a test "PValue" list of  -values
"PValueTable" formatted table of  -values
"ShortTestConclusion" a short description of the conclusion of a test "TestConclusion" a description of the conclusion of a test "TestData" list of pairs of test statistics and  -values
"TestDataTable" formatted table of  -values and test statistics
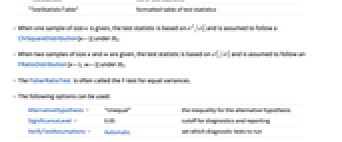
"TestStatistic" list of test statistics "TestStatisticTable" formatted table of test statistics - When one sample of size
 is given, the test statistic is based on
  and is assumed to follow a ChiSquareDistribution[n-1] under
  .
. - When two samples of size
 and
and  are given, the test statistic is based on
  and is assumed to follow an FRatioDistribution[n-1,m-1] under
  .
. - The FisherRatioTest is often called the F-test for equal variances.
- The following options can be used:
-
AlternativeHypothesis "Unequal" the inequality for the alternative hypothesis SignificanceLevel 0.05 cutoff for diagnostics and reporting VerifyTestAssumptions Automatic set which diagnostic tests to run - For the FisherRatioTest, a cutoff
 is chosen such that
  is rejected only if
  . The value of
  used for the "TestConclusion" and "ShortTestConclusion" properties is controlled by the SignificanceLevel option. This value
  is also used in diagnostic tests of assumptions including tests for normality and symmetry. By default,
  is set to 0.05.
 - Named settings for VerifyTestAssumptions in FisherRatioTest include:
-
"Normality" verify that all data is normally distributed
Examples
open all close allBasic Examples (2)
Test variances from two populations for equality:
Create a HypothesisTestData object for further property extraction:
Scope (9)
Testing (7)
Test whether the variance of a population is one:
The ![]() -values are typically large under
-values are typically large under ![]() :
:
The ![]() -values are typically small when
-values are typically small when ![]() is false:
is false:
Compare the variance of a population to a particular value:
Compare the variances of two populations:
The ![]() -values are typically large when the variances are equal:
-values are typically large when the variances are equal:
The ![]() -values are typically small when the variances are not equal:
-values are typically small when the variances are not equal:
Test whether the ratio of the variances of two datasets is a particular value:
The following forms are equivalent:
The order of the datasets should be considered when determining ![]() :
:
Create a HypothesisTestData object for repeated property extraction:
The properties available for extraction:
Extract some properties from a HypothesisTestData object:
The ![]() -value, test statistic, and degrees of freedom:
-value, test statistic, and degrees of freedom:
Options (8)
AlternativeHypothesis (3)
SignificanceLevel (2)
VerifyTestAssumptions (3)
Applications (1)
A laboratory is considering replacing a voltage meter with one that claims to be more accurate. The makers of the new meter allowed a test run to determine its effectiveness. A lab technician measured the voltage produced by 15 power supplies set to 9 volts:
A PairedTTest shows that the readings from the two meters do not differ significantly:
A test for equal variance shows that the new meter has less error than the old meter:
Properties & Relations (8)
The Fisher ratio test is equivalent to the LeveneTest for a single dataset:
It is also equivalent to the BrownForsytheTest for a single dataset:
Given a single dataset with length ![]() , the test statistic follows a ChiSquareDistribution[n-1] under
, the test statistic follows a ChiSquareDistribution[n-1] under ![]() :
:
The maximum likelihood estimate of the degrees of freedom is near ![]() :
:
The test statistic for the FisherRatioTest for two samples:
Given two datasets with lengths ![]() and
and ![]() , the test statistic follows an FRatioDistribution[n-1,m-1] under
, the test statistic follows an FRatioDistribution[n-1,m-1] under ![]() :
:
The Fisher ratio test is very sensitive to the assumption of normality:
The distribution of the test statistic is not a ChiSquareDistribution[n-1]:
For a sample of size ![]() with sample variance
with sample variance ![]() from a NormalDistribution[μ,σ], the random variable
from a NormalDistribution[μ,σ], the random variable ![]() has a ChiSquareDistribution[n-1]:
has a ChiSquareDistribution[n-1]:
The following has an FRatioDistribution[n-1,m-1]:
The test statistic for the FisherRatioTest follows an FRatioDistribution[n-1,m-1]:
The Fisher ratio test works with the values only when the input is a TimeSeries:
The Fisher ratio test works with all the values together when the input is a TemporalData:
Possible Issues (1)
The Fisher ratio test is only appropriate for normally distributed data:
Use the ConoverTest or the SiegelTukeyTest when the data is not normally distributed:
Text
Wolfram Research (2010), FisherRatioTest, Wolfram Language function, https://reference.wolfram.com/language/ref/FisherRatioTest.html.
CMS
Wolfram Language. 2010. "FisherRatioTest." Wolfram Language & System Documentation Center. Wolfram Research. https://reference.wolfram.com/language/ref/FisherRatioTest.html.
APA
Wolfram Language. (2010). FisherRatioTest. Wolfram Language & System Documentation Center. Retrieved from https://reference.wolfram.com/language/ref/FisherRatioTest.html