


FeatureSpacePlot
FeatureSpacePlot[{example1,example2,…}]
plots features extracted from the examplei as a scatter plot.
Details and Options
- FeatureSpacePlot can be used on many types of data, including numerical, textual, sounds and images, and combinations of these.
- Each examplei can be a single data element, a list of data elements, an association of data elements, or a Dataset object.
- FeatureSpacePlot[Tabular[…]cspec] extracts and plots values from the tabular object using the column specification cspec.
- The following forms of column specifications cspec are allowed for plotting tabular data:
-
{col1,…,coln} form examples from the values in the column coli - When possible, FeatureSpacePlot uses the examplei as the point marker in the scatter plot.
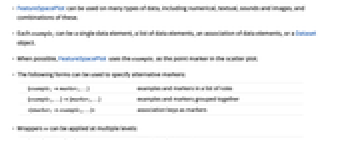
- The following forms can be used to specify alternative markers:
-
{example1marker1,…} examples and markers in a list of rules {example1,…}{marker1,…} examples and markers grouped together <marker1example1,…> association keys as markers - Wrappers w can be applied at multiple levels:
-
{…,w[examplei],…} wrap the value examplei w[{example1,example2,…}] wrap all the examples w1[w2[…]] use nested wrappers - The following wrappers w can be used for the examplei:
-
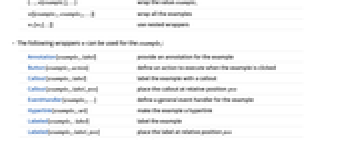
Annotation[examplei,label] provide an annotation for the example Button[examplei,action] define an action to execute when the example is clicked Callout[examplei,label] label the example with a callout Callout[examplei,label,pos] place the callout at relative position pos EventHandler[examplei,…] define a general event handler for the example Hyperlink[examplei,uri] make the example a hyperlink Labeled[examplei,label] label the example Labeled[examplei,label,pos] place the label at relative position pos Legended[examplei,label] identify the example in a legend PopupWindow[examplei,cont] attach a popup window to the example StatusArea[examplei,label] display in the status area on mouseover Style[examplei,styles] show the example using the specified styles Tooltip[examplei,label] attach a tooltip to the example Tooltip[examplei] use example values as tooltips - Callout, Labeled, Placed and LabelingFunction can use the following positions pos:
-
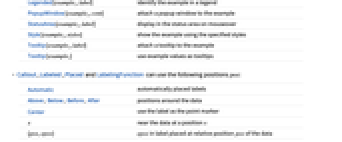
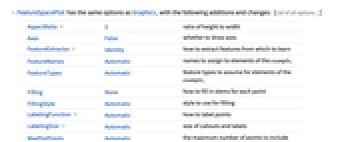
Automatic automatically placed labels Above, Below, Before, After positions around the data Center use the label as the point marker x near the data at a position x {pos,epos} epos in label placed at relative position pos of the data - FeatureSpacePlot has the same options as Graphics, with the following additions and changes: [List of all options]
-
AspectRatio 1 ratio of height to width Axes False whether to draw axes FeatureExtractor Identity how to extract features from which to learn FeatureNames Automatic names to assign to elements of the examplei FeatureTypes Automatic feature types to assume for elements of the examplei Filling None how to fill in stems for each point FillingStyle Automatic style to use for filling LabelingFunction Automatic how to label points LabelingSize Automatic size of callouts and labels LabelingTarget Automatic how to determine automatic label positions MaxPlotPoints Automatic the maximum number of points to include PerformanceGoal $PerformanceGoal aspects of performance to try to optimize PlotInteractivity $PlotInteractivity whether to allow interactive elements PlotLabel None overall label for the plot PlotLabels None labels for data PlotLegends None legends for data PlotMarkers None markers to use to indicate each point PlotRange Automatic range of values to include PlotRangeClipping True whether to clip at the plot range PlotStyle Automatic graphics directives to determine styles of points PlotTheme $PlotTheme overall theme for the plot RandomSeeding 1234 how to seed random numbers - LabelingFunctionpos places the default labels at the position pos.
- LabelingFunction->f specifies that each point should have a label given by f[value,index,lbls], where value is the value associated with the point, index is its position in the data and lbls is the list of relevant labels.
- ColorData["DefaultPlotColors"] gives the default sequence of colors used by PlotStyle.
- Possible settings for Method include:
-
Automatic automatically chosen method "LatentSemanticAnalysis" latent semantic analysis method "Linear" automatically choose the best linear method "LowRankMatrixFactorization" use a low-rank matrix factorization algorithm "PrincipalComponentsAnalysis" principal components analysis method "TSNE" t-distributed stochastic neighbor embedding algorithm "UMAP" uniform manifold approximation and projection -
 Highlight options with settings specific to FeatureSpacePlot
-
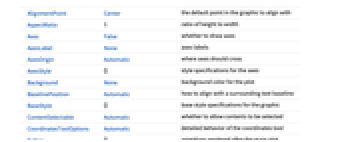
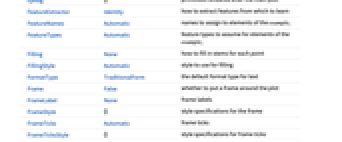
AlignmentPoint Center the default point in the graphic to align with AspectRatio 1 ratio of height to width Axes False whether to draw axes AxesLabel None axes labels AxesOrigin Automatic where axes should cross AxesStyle {} style specifications for the axes Background None background color for the plot BaselinePosition Automatic how to align with a surrounding text baseline BaseStyle {} base style specifications for the graphic ContentSelectable Automatic whether to allow contents to be selected CoordinatesToolOptions Automatic detailed behavior of the coordinates tool Epilog {} primitives rendered after the main plot FeatureExtractor Identity how to extract features from which to learn FeatureNames Automatic names to assign to elements of the examplei FeatureTypes Automatic feature types to assume for elements of the examplei Filling None how to fill in stems for each point FillingStyle Automatic style to use for filling FormatType TraditionalForm the default format type for text Frame False whether to put a frame around the plot FrameLabel None frame labels FrameStyle {} style specifications for the frame FrameTicks Automatic frame ticks FrameTicksStyle {} style specifications for frame ticks GridLines None grid lines to draw GridLinesStyle {} style specifications for grid lines ImageMargins 0. the margins to leave around the graphic ImagePadding All what extra padding to allow for labels etc. ImageSize Automatic the absolute size at which to render the graphic LabelingFunction Automatic how to label points LabelingSize Automatic size of callouts and labels LabelingTarget Automatic how to determine automatic label positions LabelStyle {} style specifications for labels MaxPlotPoints Automatic the maximum number of points to include Method Automatic details of graphics methods to use PerformanceGoal $PerformanceGoal aspects of performance to try to optimize PlotInteractivity $PlotInteractivity whether to allow interactive elements PlotLabel None overall label for the plot PlotLabels None labels for data PlotLegends None legends for data PlotMarkers None markers to use to indicate each point PlotRange Automatic range of values to include PlotRangeClipping True whether to clip at the plot range PlotRangePadding Automatic how much to pad the range of values PlotRegion Automatic the final display region to be filled PlotStyle Automatic graphics directives to determine styles of points PlotTheme $PlotTheme overall theme for the plot PreserveImageOptions Automatic whether to preserve image options when displaying new versions of the same graphic Prolog {} primitives rendered before the main plot RandomSeeding 1234 how to seed random numbers RotateLabel True whether to rotate y labels on the frame Ticks Automatic axes ticks TicksStyle {} style specifications for axes ticks
List of all options
Examples
open all close allBasic Examples (6)
Plot the features of the shapes of alphabets:
Plot the features extracted from images:
Change the size of images used as labels:
Use Callout to place labels:
Scope (24)
Data (5)
Tabular Data (1)
Plot features coming from one of the columns:
Plot multiple features per row as points, with tooltips using elements from multiple columns:
Use LabelingFunctionCallout to use features as callouts for the points:
Wrappers (9)
Use wrappers on individual examples:
Use wrappers on the entire collection of examples:
Use the value of each point as a tooltip:
Label points with automatically positioned text:
Use PopupWindow to provide additional drilldown information:
Button can be used to trigger any action:
Labeling (5)
Options (61)
AspectRatio (4)
By default, FeatureSpacePlot uses the same width and height:
Specify the height to width ratio:
AspectRatioAutomatic determines the ratio from the plot ranges:
AspectRatioFull adjusts the height and width to tightly fit inside other constructs:
Axes (3)
By default, Axes are not drawn for FeatureSpacePlot:
AxesOrigin (2)
AxesStyle (4)
FeatureExtractor (1)
Frame (3)
FeatureSpacePlot does not use a frame by default:
FrameLabel (4)
LabelingFunction (5)
Simple examples such as images and text are shown directly in the plot:
Show the examples as points with the original data in tooltips:
Center the labels at the corresponding points:
Use Callout to label the points automatically:
LabelingSize (4)
LabelingTarget (7)
Labels are automatically placed to maximize readability:
Use a denser layout for the labels:
Show the quarter of the labels that are easiest to read:
Only allow labels that are orthogonal to the points:
Only allow labels that are diagonal to the points:
Restrict labels to be above or to the right of the points:
Method (2)
PerformanceGoal (1)
PlotInteractivity (3)
PlotRangePadding (2)
PlotTheme (2)
RandomSeeding (3)
FeatureSpacePlot gives reproducible results:
Applications (1)
Properties & Relations (1)
FeatureSpacePlot is a combination of DimensionReduce and ListPlot:
Text
Wolfram Research (2017), FeatureSpacePlot, Wolfram Language function, https://reference.wolfram.com/language/ref/FeatureSpacePlot.html (updated 2025).
CMS
Wolfram Language. 2017. "FeatureSpacePlot." Wolfram Language & System Documentation Center. Wolfram Research. Last Modified 2025. https://reference.wolfram.com/language/ref/FeatureSpacePlot.html.
APA
Wolfram Language. (2017). FeatureSpacePlot. Wolfram Language & System Documentation Center. Retrieved from https://reference.wolfram.com/language/ref/FeatureSpacePlot.html