

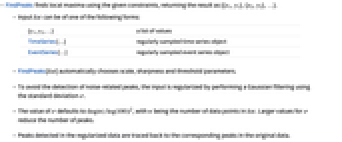
FindPeaks
FindPeaks[list]
gives positions and values of the detected peaks in list.
FindPeaks[list,σ]
finds peaks that survive Gaussian blurring up to scale σ.
FindPeaks[list,σ,s]
finds peaks with minimum sharpness s.
FindPeaks[list,σ,s,t]
finds only peaks with values greater than t.
FindPeaks[list,σ,{s,σs},{t,σt}]
uses different scales for thresholding sharpness and value.
Details and Options
- FindPeaks finds local maxima using the given constraints, returning the result as {{x1,y1},{x2,y2},…}.
- Input list can be of one of the following forms:
-
{y1,y2,…} a list of values TimeSeries[…] regularly sampled time series object EventSeries[…] regularly sampled event series object - FindPeaks[list] automatically chooses scale, sharpness and threshold parameters.
- To avoid the detection of noise-related peaks, the input is regularized by performing a Gaussian filtering using the standard deviation σ.
- The value of σ defaults to
 , with n being the number of data points in list. Larger values for σ reduce the number of peaks.
 - Peaks detected in the regularized data are traced back to the corresponding peaks in the original data.
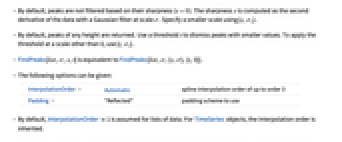
- By default, peaks are not filtered based on their sharpness (
 ). The sharpness s is computed as the second derivative of the data with a Gaussian filter at scale σ. Specify a smaller scale using {s,σs}.
 - By default, peaks of any height are returned. Use a threshold t to dismiss peaks with smaller values. To apply the threshold at a scale other than 0, use {t,σt}.
- FindPeaks[list,σ,s,t] is equivalent to FindPeaks[list,σ,{s,σ},{t,0}].
- The following options can be given:
-
InterpolationOrder Automatic spline interpolation order of up to order 3 Padding "Reflected" padding scheme to use - By default, InterpolationOrder1 is assumed for lists of data. For TimeSeries objects, the interpolation order is inherited.
- The interpolation order is used when computing peak positions. Peaks may be located in between and possibly above {x,y} samples interpolation orders.
- For interpolation orders 0 or 1, a plateau of two or more data samples is assigned a single peak at its center location.
- For possible settings for Padding, see the reference page for ArrayPad.
Examples
open all close allBasic Examples (1)
Scope (12)
Data (4)
Parameters (8)
By default, an automatic scale is used:
Compute peaks at different scales:
When finding peaks at scale ![]() , only peaks that sustain a blur up to scale
, only peaks that sustain a blur up to scale ![]() are returned:
are returned:
Signal and its blurred version at scale ![]() :
:
By default, peaks are not filtered based on their sharpness, equivalent to ![]() :
:
Specify minimum sharpness value ![]() :
:
Sharpness, defined by the negative second derivative, should be greater than the specified s:
Specify a minimum height value ![]() :
:
Apply the value threshold after smoothing the data using a scale ![]() :
:
Options (3)
InterpolationOrder (1)
By default, InterpolationOrder1 is used:
Find peaks of the cubic interpolation:
Note that the number and position of peaks may vary depending on the interpolation order:
Padding (2)
By default, Padding"Reflected" is used:
Padding influences the occurrence and position of peaks at the boundary:
By default, "Reflected" padding causes a peak at position 1:
Applications (6)
Find peaks in the stock price of Apple in the year 2013:
Highlight peaks on the plot of the data:
Mean daily temperatures for Chicago during a period of two months:
Find peaks in the temperature:
Detect the mode of a distribution using the peak of its histogram. Sample a Fréchet distribution:
Find the mode of the distribution:
Compare the mode with the theoretical value of the Fréchet distribution:
Use peaks of an audio power spectrum to detect pitches of the sound:
Compute the power periodogram:
Text
Wolfram Research (2014), FindPeaks, Wolfram Language function, https://reference.wolfram.com/language/ref/FindPeaks.html (updated 2021).
CMS
Wolfram Language. 2014. "FindPeaks." Wolfram Language & System Documentation Center. Wolfram Research. Last Modified 2021. https://reference.wolfram.com/language/ref/FindPeaks.html.
APA
Wolfram Language. (2014). FindPeaks. Wolfram Language & System Documentation Center. Retrieved from https://reference.wolfram.com/language/ref/FindPeaks.html