


TorusGraph
TorusGraph[{n1,n2,…,nk}]
gives the k-dimensional torus graph with n1×n2×…×nk vertices.
Details and Options
- TorusGraph is also known as toroidal graph.
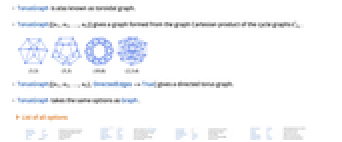
- TorusGraph[{n1,n2,…,nk}] gives a graph formed from the graph Cartesian product of the cycle graphs
 .
. - TorusGraph[{n1,n2,…,nk},DirectedEdges->True] gives a directed torus graph.
- TorusGraph takes the same options as Graph.
-
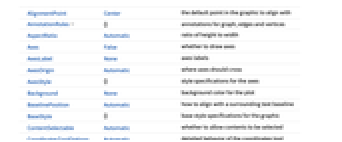
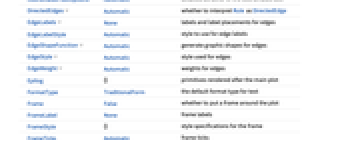
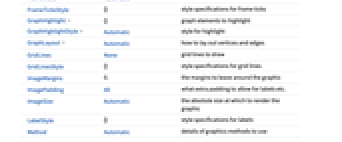
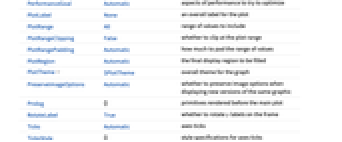
AlignmentPoint Center the default point in the graphic to align with AnnotationRules {} annotations for graph, edges and vertices AspectRatio Automatic ratio of height to width Axes False whether to draw axes AxesLabel None axes labels AxesOrigin Automatic where axes should cross AxesStyle {} style specifications for the axes Background None background color for the plot BaselinePosition Automatic how to align with a surrounding text baseline BaseStyle {} base style specifications for the graphic ContentSelectable Automatic whether to allow contents to be selected CoordinatesToolOptions Automatic detailed behavior of the coordinates tool DirectedEdges Automatic whether to interpret Rule as DirectedEdge EdgeLabels None labels and label placements for edges EdgeLabelStyle Automatic style to use for edge labels EdgeShapeFunction Automatic generate graphic shapes for edges EdgeStyle Automatic style used for edges EdgeWeight Automatic weights for edges Epilog {} primitives rendered after the main plot FormatType TraditionalForm the default format type for text Frame False whether to put a frame around the plot FrameLabel None frame labels FrameStyle {} style specifications for the frame FrameTicks Automatic frame ticks FrameTicksStyle {} style specifications for frame ticks GraphHighlight {} graph elements to highlight GraphHighlightStyle Automatic style for highlight GraphLayout Automatic how to lay out vertices and edges GridLines None grid lines to draw GridLinesStyle {} style specifications for grid lines ImageMargins 0. the margins to leave around the graphic ImagePadding All what extra padding to allow for labels etc. ImageSize Automatic the absolute size at which to render the graphic LabelStyle {} style specifications for labels Method Automatic details of graphics methods to use PerformanceGoal Automatic aspects of performance to try to optimize PlotLabel None an overall label for the plot PlotRange All range of values to include PlotRangeClipping False whether to clip at the plot range PlotRangePadding Automatic how much to pad the range of values PlotRegion Automatic the final display region to be filled PlotTheme $PlotTheme overall theme for the graph PreserveImageOptions Automatic whether to preserve image options when displaying new versions of the same graphic Prolog {} primitives rendered before the main plot RotateLabel True whether to rotate y labels on the frame Ticks Automatic axes ticks TicksStyle {} style specifications for axes ticks VertexCoordinates Automatic coordinates for vertices VertexLabels None labels and placements for vertices VertexLabelStyle Automatic style to use for vertex labels VertexShape Automatic graphic shape for vertices VertexShapeFunction Automatic generate graphic shapes for vertices VertexSize Medium size of vertices VertexStyle Automatic styles for vertices VertexWeight Automatic weights for vertices
List of all options
Examples
open all close allBasic Examples (2)
Options (83)
DirectedEdges (1)
By default, an undirected graph is generated:
Use DirectedEdges->True to generate a directed graph:
EdgeLabels (7)
Use any expression as a label:
Use Placed with symbolic locations to control label placement along an edge:
Use explicit coordinates to place labels:
Vary positions within the label:
Use automatic labeling by values through Tooltip and StatusArea:
EdgeShapeFunction (6)
Get a list of built-in settings for EdgeShapeFunction:
Undirected edges including the basic line:
Lines with different glyphs on the edges:
Directed edges including solid arrows:
Specify an edge function for an individual edge:
Combine with a different default edge function:
Draw edges by running a program:
EdgeShapeFunction can be combined with EdgeStyle:
EdgeShapeFunction has higher priority than EdgeStyle:
EdgeWeight (3)
GraphHighlight (3)
GraphHighlightStyle (2)
Get a list of built-in settings for GraphHighlightStyle:
Use built-in settings for GraphHighlightStyle:
GraphLayout (5)
By default, the layout is chosen automatically:
Specify layouts on special curves:
Specify layouts that satisfy optimality criteria:
VertexCoordinates overrides GraphLayout coordinates:
Use AbsoluteOptions to extract VertexCoordinates computed using a layout algorithm:
PlotTheme (4)
VertexCoordinates (3)
By default, any vertex coordinates are computed automatically:
Extract the resulting vertex coordinates using AbsoluteOptions:
Specify a layout function along an ellipse:
Use it to generate vertex coordinates for a graph:
VertexCoordinates has higher priority than GraphLayout:
VertexLabels (13)
Use any expression as a label:
Use Placed with symbolic locations to control label placement, including outside positions:
Symbolic outside corner positions:
Symbolic inside corner positions:
Use explicit coordinates to place the center of labels:
Place all labels at the upper-right corner of the vertex and vary the coordinates within the label:
Any number of labels can be used:
Use the argument to Placed to control formatting including Tooltip:
Or StatusArea:
VertexShape (5)
Use any Graphics, Image or Graphics3D as a vertex shape:
Specify vertex shapes for individual vertices:
VertexShape can be combined with VertexSize:
VertexShape is not affected by VertexStyle:
VertexShapeFunction has higher priority than VertexShape:
VertexShapeFunction (10)
Get a list of built-in collections for VertexShapeFunction:
Use built-in settings for VertexShapeFunction in the "Basic" collection:
Use built-in settings for VertexShapeFunction in the "Rounded" collection:
Use built-in settings for VertexShapeFunction in the "Concave" collection:
Combine with a default vertex function:
Draw vertices using a predefined graphic:
Draw vertices by running a program:
VertexShapeFunction can be combined with VertexStyle:
VertexShapeFunction has higher priority than VertexStyle:
VertexShapeFunction can be combined with VertexSize:
VertexShapeFunction has higher priority than VertexShape:
VertexSize (8)
By default, the size of vertices is computed automatically:
Specify the size of all vertices using symbolic vertex size:
Use a fraction of the minimum distance between vertex coordinates:
Use a fraction of the overall diagonal for all vertex coordinates:
Specify size in both the ![]() and
and ![]() directions:
directions:
Specify the size for individual vertices:
VertexSize can be combined with VertexShapeFunction:
VertexSize can be combined with VertexShape:
VertexStyle (5)
VertexShapeFunction can be combined with VertexStyle:
VertexShapeFunction has higher priority than VertexStyle:
VertexStyle can be combined with BaseStyle:
VertexStyle has higher priority than BaseStyle:
VertexShape is not affected by VertexStyle:
Applications (11)
Basic Applications (6)
Properties & Relations (6)
TorusGraph[{n1,n2,…}] has self-loops if one of ![]() is 1:
is 1:
TorusGraph[{n1,n2,…}] has parallel edges if one of ![]() is 2:
is 2:
TorusGraph[{n}] is a cycle graph:
TorusGraph[{m,n}] is the graph formed from the Cartesian product of the cycle graphs ![]() and
and ![]() :
:
TorusGraph has the same number of vertices as GridGraph:
The difference between the number of edges of TorusGraph[f] and GridGraph[f]:
Possible Issues (1)
Large torus graphs do not automatically display as a plot of graph:
Use GraphPlot to plot the graph:
Neat Examples (1)
Text
Wolfram Research (2022), TorusGraph, Wolfram Language function, https://reference.wolfram.com/language/ref/TorusGraph.html.
CMS
Wolfram Language. 2022. "TorusGraph." Wolfram Language & System Documentation Center. Wolfram Research. https://reference.wolfram.com/language/ref/TorusGraph.html.
APA
Wolfram Language. (2022). TorusGraph. Wolfram Language & System Documentation Center. Retrieved from https://reference.wolfram.com/language/ref/TorusGraph.html