DensityGraphics
As of Version 6.0, DensityGraphics has been superseded by GraphicsComplex and related functionality.
DensityGraphics[array]
is a representation of a density plot.
Details and Options
- array must be a rectangular array of real numbers, representing z values.
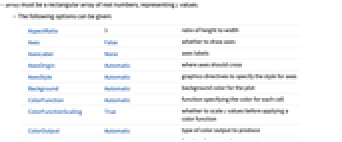
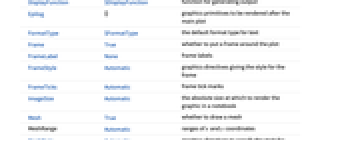
- The following options can be given:
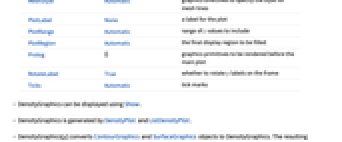
-
AspectRatio 1 ratio of height to width Axes False whether to draw axes AxesLabel None axes labels AxesOrigin Automatic where axes should cross AxesStyle Automatic graphics directives to specify the style for axes Background Automatic background color for the plot ColorFunction Automatic function specifying the color for each cell ColorFunctionScaling True whether to scale z values before applying a color function ColorOutput Automatic type of color output to produce DisplayFunction $DisplayFunction function for generating output Epilog {} graphics primitives to be rendered after the main plot FormatType $FormatType the default format type for text Frame True whether to put a frame around the plot FrameLabel None frame labels FrameStyle Automatic graphics directives giving the style for the frame FrameTicks Automatic frame tick marks ImageSize Automatic the absolute size at which to render the graphic in a notebook Mesh True whether to draw a mesh MeshRange Automatic ranges of x and y coordinates MeshStyle Automatic graphics directives to specify the style for mesh lines PlotLabel None a label for the plot PlotRange Automatic range of z values to include PlotRegion Automatic the final display region to be filled Prolog {} graphics primitives to be rendered before the main plot RotateLabel True whether to rotate y labels on the frame Ticks Automatic tick marks - DensityGraphics can be displayed using Show.
- DensityGraphics is generated by DensityPlot and ListDensityPlot.
- DensityGraphics[g] converts ContourGraphics and SurfaceGraphics objects to DensityGraphics. The resulting graphics can be rendered using Show.
- Graphics[DensityGraphics[…]] generates a representation in terms of an ordinary Graphics object.
- SparseArray objects can be used in DensityGraphics.
Wolfram Research (1988), DensityGraphics, Wolfram Language function, https://reference.wolfram.com/language/ref/DensityGraphics.html (updated 2003).
Text
Wolfram Research (1988), DensityGraphics, Wolfram Language function, https://reference.wolfram.com/language/ref/DensityGraphics.html (updated 2003).
CMS
Wolfram Language. 1988. "DensityGraphics." Wolfram Language & System Documentation Center. Wolfram Research. Last Modified 2003. https://reference.wolfram.com/language/ref/DensityGraphics.html.
APA
Wolfram Language. (1988). DensityGraphics. Wolfram Language & System Documentation Center. Retrieved from https://reference.wolfram.com/language/ref/DensityGraphics.html