Date & Time Visualization
The Wolfram Language provides a variety of functions for visualizing data with dates and times. The plotting functions are highly flexible, allowing the dates and times to be input in a number of representations that are automatically interpreted. Plots use the full power of the Wolfram Language data visualization functions and features to be both endlessly customizable and easy to use.
 TimelinePlot — display dates and times on a timeline, with labels, etc.
 ClockGauge — display time on a clock face
Values versus Time
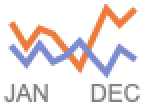 DateListPlot — plot date-value curves
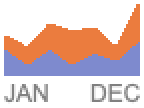 StackedDateListPlot — plot curves stacked on top of each other
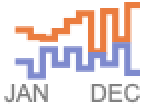 DateListStepPlot ▪
 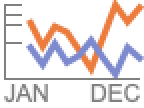 DateListLogPlot
Prices versus Time »
 TradingChart — trading chart with technical indicators
 InteractiveTradingChart ▪
  CandlestickChart ▪
  KagiChart ▪ ...
Counts versus Time
 DateHistogram — plot a histogram of dates or times, showing events per time
 SmoothDateHistogram — plot a smooth kernel histogram of dates or times
Time & Event Series
TimeSeries — plot multi-component time series using rule syntax
DateListPlot ▪ ListFitPlot ▪ ...
EventSeries — plot multi-component event series using rule syntax
DateHistogram ▪ TimelinePlot ▪ ...
Date Scales for Any Visualization Function
ScalingFunctions — specify date or time scale for any axis
"Date" — named scaling function for dates
"Time" — named scaling function for times
DateScale — detailed control over date and time scales
BarChart ▪ BarChart3D ▪ BubbleChart ▪ BubbleChart3D ▪ ContourPlot ▪ ContourPlot3D ▪ CumulativeFeatureImpactPlot ▪ DateHistogram ▪ DateListLogPlot ▪ DateListPlot ▪ DateListStepPlot ▪ DateScale ▪ DensityHistogram ▪ DensityPlot ▪ DensityPlot3D ▪ DiscretePlot ▪ DiscretePlot3D ▪ DistributionChart ▪ FeatureImpactPlot ▪ ListContourPlot ▪ ListDensityPlot ▪ ListFitPlot ▪ ListFitPlot3D ▪ ListLinePlot ▪ ListLinePlot3D ▪ ListLogLinearPlot ▪ ListLogPlot ▪ ListPlot ▪ ListPlot3D ▪ ListPointPlot3D ▪ ListStepPlot ▪ LogLinearPlot ▪ LogPlot ▪ PairedBarChart ▪ PairwiseDensityHistogram ▪ PairwiseListPlot ▪ ParallelAxisPlot ▪ ParametricPlot ▪ ParametricPlot3D ▪ Plot ▪ Plot3D ▪ PointValuePlot ▪ RadialAxisPlot ▪ RectangleChart ▪ RectangleChart3D ▪ RegionPlot ▪ RegionPlot3D ▪ SphericalPlot3D ▪ StackedListPlot
Options
DateTicksFormat — formatting of date ticks
DateFunction — how to interpret dates
DateReduction — how to reduce dates to cyclic periods of time, e.g. hours, weeks, etc.