Financial Visualization
Financial visualization is used to understand how the price of stocks, commodities, currencies, etc. changes over time. Candlesticks and related charts use stylized glyphs to represent multiple prices, such as open, high, low, and close prices. Trading charts add additional indicators to highlight different price signals, such as volume, trends, inertia, momentum, etc. Renko and related charts instead focus on the change in prices and compress time when there is little change. Wolfram Language financial visualization functions automatically use built-in financial data or can use price data from other sources. Charts provide a high level of automation for aesthetics and financial computations, as well as detailed options for tuning and extensibility. The Wolfram Language provides a built-in library of around 100 financial indicators with automatic or specified settings and aesthetics to combine with the financial visualizations.
Prices vs. Time
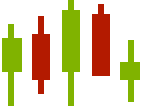 CandlestickChart — candlestick and OHLC chart of open-high-low-close prices
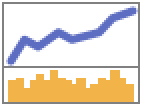
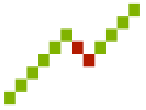
DateListPlot — line chart of prices
Prices and Indicators
 TradingChart — complete trading chart, possibly including technical indicators
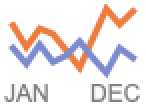
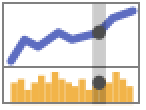 InteractiveTradingChart — interactive trading chart
FinancialIndicator — symbolic representation of technical indicators
Prices vs. Change
 KagiChart — Kagi chart of prices
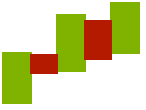
 RenkoChart — Renko chart of prices
 PointFigureChart — point and figure chart of prices
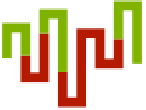
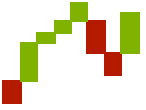 LineBreakChart —
 ![]() -line break chart of prices
-line break chart of prices
Options for Styling and Labeling »
ChartElementFunction — function used to generate graphics for chart elements
EventLabels — labeling for particular dates in financial data
TrendStyle — styles used for up and down trends
BarSpacing ▪ DateFunction ▪ ColorFunction ▪ ScalingFunctions ▪ ...
Date & Time Visualization »
 DateListPlot ▪
 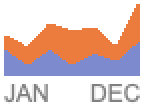 StackedDateListPlot ▪
 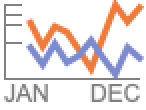 DateListLogPlot ▪ ...
Data Visualization »
 ListPlot ▪
  ListPlot3D ▪
  ListContourPlot ▪ ...