Data Visualization
 Topic Overview
 Using a host of original algorithms developed at Wolfram Research, the Wolfram Language provides powerful functions that automate the process of creating cognitively and aesthetically compelling representations of structured and unstructured data—not only for points, lines, and surfaces, but also for graphs and networks.
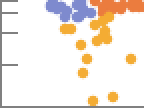
 ListPlot — plot lists of points
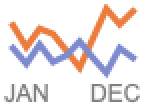
 ListLinePlot — plot lines through lists of points
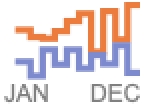
 ListStepPlot — plots values in steps
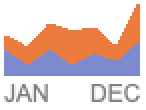
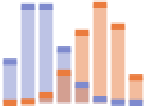
 StackedListPlot — plots multiple curves by stacking them on each other
 ListLogPlot ▪ ListLogLinearPlot ▪ ListLogLogPlot ▪
 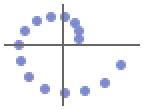 ListPolarPlot
 ListPlot3D — 3D plot from lists of 3D height data
 ListPointPlot3D — 3D point scatter plot
 ListLinePlot3D — 3D curve plot
 ListDensityPlot,
  ListDensityPlot3D — color density plots from 3D and 4D height data
 ListContourPlot,
  ListContourPlot3D — iso contour plots from 3D and 4D height data
 ListSliceDensityPlot3D — color densities on surface slices through 4D height data
 ListSliceContourPlot3D — contour shading on surface slices through 4D height data
 ListCurvePathPlot,
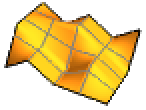
  ListSurfacePlot3D — reconstruct curves and surfaces from points
 ArrayPlot — plot an array of values or colors
 ReliefPlot — plot an array with simulated relief
 MatrixPlot — plot values in a matrix
 ArrayPlot3D — plot a 3D array of values
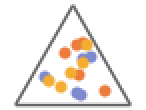
 TernaryListPlot — plot 3D data in a triangle of axes using barycentric coordinates
Date & Time Visualization »
 DateListPlot, DateListLogPlot — date and time plots
 TimelinePlot — timeline allowing labeling
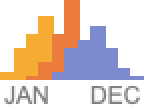
 DateHistogram — histogram of dates or times
 DateListStepPlot ▪
  StackedDateListPlot
Vector Visualization »
 ListVectorPlot — plot vectors from a vector field
 ListStreamPlot — plot streamlines from a vector field
 ListVectorPlot3D ▪
  ListStreamPlot3D ▪
  ListSliceVectorPlot3D ▪ ...
Charting & Information Visualization »
 BarChart ▪
  PieChart ▪
  BubbleChart ▪
  BarChart3D ▪ ...
Statistical Visualization »
 Histogram ▪
  Histogram3D ▪
  QuantilePlot ▪
  BoxWhiskerChart ▪ ...
Gauges »
 AngularGauge ▪
  HorizontalGauge ▪
  VerticalGauge ▪ ...
High-Dimensional Visualization »
 RadialAxisPlot ▪
  PairwiseListPlot ▪
  FeatureSpacePlot ▪ ...
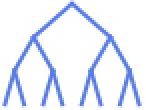
Graph Visualization »
 GraphPlot ▪
 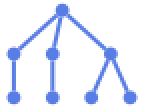 LayeredGraphPlot ▪
 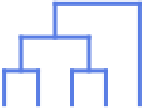 TreePlot ▪ ...
Hierarchical Data Visualization
Visualization of Tabular Data »
Grid ▪ Row ▪ Column ▪ Multicolumn ▪ GraphicsGrid ▪ GraphicsRow ▪ ...
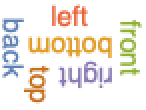
Collective Data Visualization
 WordCloud ▪ ImageCollage ▪ ImageAssemble
Geographic Visualization »
 GeoListPlot ▪
  GeoSmoothHistogram ▪
 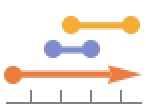 GeoRegionValuePlot ▪ ...
Interval Visualization
 NumberLinePlot — plot points and intervals on the number line
Discrete Function Visualization »
 DiscretePlot — plot functions
 ![]() of a discrete variable
of a discrete variable
Anatomy Visualization
 AnatomyPlot3D — visualization of anatomical structures
Wavelet Visualization »
 WaveletScalogram ▪
  WaveletListPlot ▪
 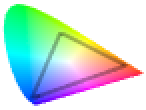 WaveletMatrixPlot ▪ ...
Color Space Visualization »
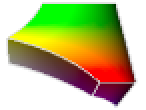 ChromaticityPlot ▪
 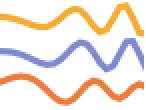 ChromaticityPlot3D
Styling Options »
Frame ▪ PlotStyle ▪ Filling ▪ Mesh ▪ ImageSize ▪ ...
Labels »
PlotLabels ▪ Labeled ▪ Callout ▪ ...
Legends »
PlotLegends ▪ Legended ▪ LineLegend ▪ BarLegend ▪ ...
Annotation & Combination »
Tooltip ▪ StatusArea ▪ Inset ▪ ...
Error Bars & Uncertainty »
Around ▪ IntervalMarkers ▪ ...