


ChromaticityPlot
ChromaticityPlot[colspace]
plots a 2D slice of the color space colspace.
ChromaticityPlot[color]
plots the specific color.
ChromaticityPlot[{col1,col2,…}]
plots multiple colors and color spaces.
ChromaticityPlot[image]
plots the pixels of image as individual colors.
ChromaticityPlot[…,refcolspace]
uses the reference color space refcolspace.
Details and Options
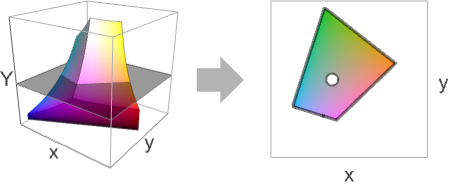
- ChromaticityPlot is also known as chromatic diagram.
- Typically used to visualize one or several color spaces compared to the visual spectrum. It is also used to visualize one or several colors in an image.
- ChromaticityPlot converts the color coordinates in colspace to coordinates in refcolspace color space and displays a slice given by constant luminance 0.01. For an individual color, the resulting converted color is projected to the slice of constant luminance.
- Color specification color can be any color directive or a color neighborhood given as a ColorsNear object.
- Possible colspace values that can also be a ColorSpace option setting are:
-
"Grayscale" GrayLevel "RGB" RGBColor "CMYK" CMYKColor "HSB" Hue "XYZ" XYZColor "LAB" LABColor "LCH" LCHColor "LUV" LUVColor ColorProfileData[…][i] color profile with the specified rendering intent 
- Other possible colspace values:
-
"AdobeRGB" Adobe RGB (1998) color space "AppleRGB" Apple RGB color space "CIERGB" CIE RGB color space "ProPhotoRGB" ProPhoto RGB "sRGB" standard sRGB color space "WideGamutRGB" large gamut RGB (a.k.a. Adobe Wide Gamut RGB) - Possible refcolspace specifications include:
-
"CIE31" CIE 1931 xy chromaticity diagram (default) "CIE76" CIE 1976 UCS chromaticity diagram {"ref",l} any of the above spaces at luminance 
- Luminance is the Y coordinate of the XYZ space.
- Colors or image pixels are rendered as black points if their luminance is the same as the reference luminance and as gray points otherwise.
- ChromaticityPlot accepts all Graphics options with the following additions and changes: [List of all options]
-
Appearance Automatic appearance of visible spectrum BoundaryStyle Automatic the style for the boundary of each region FillingStyle Automatic filling style for each color space Frame True whether to show the frame FrameLabel Automatic frame labels MaxPlotPoints 2000 maximum number of colors or pixels to show PlotLegends Automatic legends for each space PlotPoints Automatic initial number of sample points PlotRange Automatic the range of values to include in the plot PlotRangeClipping True whether to clip at the plot range PlotStyle Automatic specify the style for colors and images PlotTheme $PlotTheme overall theme for the plot WhitePoint Automatic what white point to show - Possible settings for Appearance are:
-
None do not show the visible spectrum Automatic automatically determine appearance "VisibleSpectrum" curve corresponding to the visible spectrum "FilledVisibleSpectrum" filled visible spectrum (default) - Typical settings for PlotLegends include:
-
None add no legend Automatic use automatic legending "Expressions" use colspace name as legend labels {lbl1,lbl2,…} use lbli for the i ") input
inputPlaced[lspec,…] specify placement of legend - Possible settings for WhitePoint include:
-
Automatic automatically determine the white point to use None no white points All all white points "name" use a named white point col use the color col as white point {wp1,…} show several white points wpi
List of all options
Examples
open all close allBasic Examples (2)
Scope (7)
Chromaticity diagram of an ICC profile:
profile = Import[FindFile["USWebCoatedSWOP.icc"]];ChromaticityPlot[profile, {"CIE31", .1}]Visualize a random list of RGB colors:
ChromaticityPlot[RandomColor[100]]Visualize the pixels of an image:
img = [image];ChromaticityPlot[img]Visualize the pixels of a 3D image:
img = [image];ChromaticityPlot[img]Specify the reference color space:
ChromaticityPlot["sRGB", "CIE31"]ChromaticityPlot["sRGB", {"CIE31", .7}]CIE 1976 UCS (uniform chromaticity scale) diagram:
ChromaticityPlot["sRGB", "CIE76"]Visualize distribution of an image's pixels as well as a color space:
ChromaticityPlot[{"RGB", [image]}]Options (72)
Appearance (5)
By default, a filled visible spectrum is rendered:
ChromaticityPlot["sRGB"]Show the boundary of the visible spectrum only:
ChromaticityPlot["sRGB", Appearance -> "VisibleSpectrum"]Use Appearance->None to remove the visible spectrum:
ChromaticityPlot["sRGB", Appearance -> None]Use PlotStyle as a suboption to specify a custom style:
ChromaticityPlot["sRGB", Appearance -> {"VisibleSpectrum", PlotStyle -> Red}]Display wavelengths on the visible spectrum using the "Wavelengths"->True suboption:
ChromaticityPlot["sRGB", Appearance -> {"VisibleSpectrum", "Wavelengths" -> True}]AspectRatio (3)
By default, ChromaticityPlot determines the height to width ratio from the plot range:
ChromaticityPlot["RGB"]Make the height the same as the width with AspectRatio1:
ChromaticityPlot["RGB", AspectRatio -> 1]Make the height half of the width:
ChromaticityPlot["RGB", AspectRatio -> 1 / 2]AspectRatioFull adjusts the height and width to tightly fit inside other constructs:
plot = ChromaticityPlot["RGB", AspectRatio -> Full];{Framed[Pane[plot, {200, 150}]], Framed[Pane[plot, {150, 200}]]}Axes (3)
By default, ChromaticityPlot uses a frame instead of axes:
ChromaticityPlot["RGB"]ChromaticityPlot["RGB", Frame -> False, Axes -> True]Turn each axis on individually:
{ChromaticityPlot["RGB", Frame -> False, Axes -> {True, False}], ChromaticityPlot["RGB", Frame -> False, Axes -> {False, True}]}AxesLabel (3)
Axes are not labeled by default:
ChromaticityPlot["RGB", Frame -> False, Axes -> True]ChromaticityPlot["RGB", Frame -> False, Axes -> True, AxesLabel -> "Y axis"]ChromaticityPlot["RGB", Frame -> False, Axes -> True, AxesLabel -> {"X-axis", "Y-axis"}]AxesOrigin (2)
AxesStyle (4)
ChromaticityPlot["RGB", Frame -> False, Axes -> True, AxesStyle -> Red]Specify the style of each axis:
ChromaticityPlot["RGB", Frame -> False, Axes -> True, AxesStyle -> {{Thick, Red}, {Thick, Blue}}]Use different styles for the ticks and the axes:
ChromaticityPlot["RGB", Frame -> False, Axes -> True, AxesStyle -> Green, TicksStyle -> Red]Use different styles for the labels and the axes:
ChromaticityPlot["RGB", Frame -> False, Axes -> True, AxesStyle -> Green, LabelStyle -> Red]BoundaryStyle (2)
By default, the boundary style is automatically chosen:
ChromaticityPlot["sRGB"]ChromaticityPlot["sRGB", BoundaryStyle -> Red]Use BoundaryStyle->None to show no boundary:
ChromaticityPlot["sRGB", BoundaryStyle -> None]Specify boundary style for different color spaces:
ChromaticityPlot[{"RGB", "AdobeRGB"}, BoundaryStyle -> {{Blue, Thick}, Red}]FillingStyle (5)
By default, the gamut is not filled:
ChromaticityPlot["sRGB", {"CIE31", .5}, Appearance -> "VisibleSpectrum"]ChromaticityPlot["sRGB", {"CIE31", .5}, Appearance -> "VisibleSpectrum", FillingStyle -> Opacity[1]]Filled gamuts of multiple color spaces:
ChromaticityPlot[{"WideGamutRGB", "CIERGB", "RGB"}, {"CIE31", .5}, Appearance -> "VisibleSpectrum", FillingStyle -> Opacity[.8]]Individually define the filling style for each space:
ChromaticityPlot[{"WideGamutRGB", "CIERGB", "RGB"}, {"CIE31", .5}, FillingStyle -> {Opacity[1], RGBColor[1, 0, 0, .8], Green}, Appearance -> "VisibleSpectrum"]If the specified list of styles is shorter than the list of color spaces, it is cyclically padded:
ChromaticityPlot[{"CIERGB", "RGB", "WideGamutRGB"}, {"CIE31", .5}, FillingStyle -> {None, Opacity[1], None}, Appearance -> "VisibleSpectrum"]Frame (4)
ChromaticityPlot uses a frame by default:
ChromaticityPlot["RGB"]Use FrameFalse to turn off the frame:
ChromaticityPlot["RGB", Frame -> False]Draw the frame on the left and right edges:
ChromaticityPlot["RGB", Frame -> {{True, True}, {False, False}}]Draw the frame on the left and bottom edges:
ChromaticityPlot["RGB", Frame -> {{True, False}, {True, False}}]FrameLabel (5)
By default, appropriate labels are displayed for each coordinate:
ChromaticityPlot["sRGB", #, ImageSize -> Small]& /@ {"CIE31", "CIE76"}Place a label along the bottom frame of the chart:
ChromaticityPlot["RGB", FrameLabel -> {"label"}]Frame labels are placed on the bottom and left frame edges by default:
ChromaticityPlot["RGB"]Place labels on each of the edges in the frame:
ChromaticityPlot["RGB", FrameLabel -> {{"left", "right"}, {"bottom", "top"}}]Use a customized style for both labels and frame tick labels:
ChromaticityPlot["RGB", FrameLabel -> {{"left", "right"}, {"bottom", "top"}}, LabelStyle -> Directive[Bold, StandardBrown]]FrameStyle (2)
Specify a style for the frame:
ChromaticityPlot["RGB", FrameStyle -> Directive[StandardRed, Thick]]Specify style for each frame edge:
ChromaticityPlot["RGB", FrameStyle -> {{Directive[StandardGreen, Thick], Directive[StandardRed]}, {Directive[Gray, Thick], Directive[StandardBlue]}}]FrameTicks (6)
Frame ticks are placed automatically by default:
ChromaticityPlot["RGB"]By default, the top and right edges have tick marks but no tick labels:
ChromaticityPlot["RGB"]Use All to include tick labels on all edges:
ChromaticityPlot["RGB", FrameTicks -> All]Place tick marks at specific positions:
ChromaticityPlot["RGB", FrameTicks -> {{{.1, .5, .8}, Automatic}, {Automatic, Automatic}}]Draw frame tick marks at the specified positions with specific labels:
ChromaticityPlot["RGB", FrameTicks -> {{{{.1, a}, {.5, b}, {.8, c}}, Automatic}, {{{.1, a}, {.5, b}, {.8, c}}, Automatic}}]Specify the lengths for tick marks as a fraction of the graphics size:
ChromaticityPlot["RGB", FrameTicks -> {{{{.1, a, .1}, {.5, b, .1}, {.8, c, .1}}, Automatic}, {{{.1, a, .2}, {.5, b, .2}, {.8, c, .2}}, Automatic}}]Use different sizes in the positive and negative directions for each tick mark:
ChromaticityPlot["RGB", FrameTicks -> {{{{.1, a, {.1, .1}}, {.5, b, {.1, .1}}, {.8, c, {.1, .1}}}, Automatic}, {{{.1, a, {.2, .05}}, {.5, b, {.2, .05}}, {.8, c, {.2, .05}}}, Automatic}}]Specify a style for each frame tick:
ChromaticityPlot["RGB", FrameTicks -> {{{{.1, a, {.1, .1}, Directive[Thick, Blue, Dashed]}, {.5, b, {.1, .1}, Directive[Thick, Green]}, {.8, c, {.1, .1}, Directive[Thick, Red]}}, Automatic}, {Automatic, Automatic}}]FrameTicksStyle (3)
By default, the frame ticks and frame tick labels use the same styles as the frame:
ChromaticityPlot["RGB", FrameStyle -> Directive[Red]]Specify an overall style for the ticks, including the labels:
ChromaticityPlot["RGB", FrameTicksStyle -> Directive[Blue, Thick]]Use a different style for each frame edge:
ChromaticityPlot["RGB", FrameTicksStyle -> {{Directive[Red, Thick], Directive[Blue, Thick]}, {Directive[Orange, Thick], Directive[Darker@Green, Thick]}}, FrameTicks -> All]MaxPlotPoints (1)
PlotLegends (2)
By default, the legends are not shown for one color space:
ChromaticityPlot["RGB"]ChromaticityPlot["RGB", PlotLegends -> "Expressions"]By default, the legends are shown for gamut comparison:
ChromaticityPlot[{"RGB", "AdobeRGB"}]ChromaticityPlot[{"RGB", "AdobeRGB"}, PlotLegends -> None]PlotPoints (1)
Automatic setting of PlotPoints might not be sufficient for rendering very small regions:
ChromaticityPlot["RGB", {"CIE31", .96}]Increase the plot points to see the region:
ChromaticityPlot["RGB", {"CIE31", .96}, PlotPoints -> 50]PlotRange (3)
By default, the plot range used is sufficient for all the supported color spaces:
ChromaticityPlot[{"ProPhotoRGB", "WideGamutRGB"}]The default plot range may be too small for samples from an unbounded space:
ChromaticityPlot[RandomColor[XYZColor[_, _, _], 2000]]Choose a plot range that encompasses everything in the plot:
ChromaticityPlot[RandomColor[XYZColor[_, _, _], 5000], PlotRange -> All]ChromaticityPlot["RGB", PlotRange -> {{.1, .7}, {.0, .65}}]PlotStyle (1)
PlotTheme (3)
Use a theme with dark background in a high-contrast color scheme:
ChromaticityPlot[{"sRGB", "WideGamutRGB"}, PlotTheme -> "Marketing"]ChromaticityPlot[{"sRGB", "WideGamutRGB"}, PlotTheme -> "Marketing", BoundaryStyle -> {Blue, Darker@Magenta}]ChromaticityPlot[{"sRGB", "WideGamutRGB"}, PlotTheme -> "Monochrome"]Ticks (6)
Ticks are placed automatically on each axis:
ChromaticityPlot["RGB", Frame -> False, Axes -> True]Use TicksNone to draw axes without any tick marks:
ChromaticityPlot["RGB", Frame -> False, Axes -> True, Ticks -> None]Place tick marks at the specified positions:
ChromaticityPlot["RGB", Frame -> False, Axes -> True, Ticks -> {{.1, .5, .8}, {.1, .5, .8}}]Draw tick marks at the specified positions with specific labels:
ChromaticityPlot["RGB", Frame -> False, Axes -> True, Ticks -> {{{.1, a}, {.5, b}, {.8, c}}, {{.1, a}, {.5, b}, {.8, c}}}]Specify the lengths for ticks as a fraction of graphics size:
ChromaticityPlot["RGB", Frame -> False, Axes -> True, Ticks -> {{{.1, a, .1}, {.5, b, .1}, {.8, c, .1}}, {{.1, a, .2}, {.5, b, .2}, {.8, c, .2}}}]Use different sizes in the positive and negative directions for each tick:
ChromaticityPlot["RGB", Frame -> False, Axes -> True, Ticks -> {{{.1, a, {.1, .1}}, {.5, b, {.1, .15}}, {.8, c, {.1, .2}}}, Automatic}]Specify a style for each tick:
ChromaticityPlot["RGB", Frame -> False, Axes -> True, Ticks -> {{{.04, a, .45, Directive[Thick, Red]}, {.64, b, .35, Directive[Red]}, {.72, c, .28, Directive[Thick, Blue]}}, Automatic}]TicksStyle (4)
By default, the ticks and tick labels use the same styles as the axis:
ChromaticityPlot["RGB", Frame -> False, Axes -> True]Specify an overall ticks style, including for tick labels:
ChromaticityPlot["RGB", Frame -> False, Axes -> True, TicksStyle -> Red]Specify a ticks style for each of the axes:
ChromaticityPlot["RGB", Frame -> False, Axes -> True, TicksStyle -> {Directive[Red, Thick], Directive[Blue, Thick]}]Use a different style for the tick labels and tick marks:
ChromaticityPlot["RGB", Frame -> False, Axes -> True, TicksStyle -> Directive[Red, Thick], LabelStyle -> Blue]WhitePoint (4)
By default, the white point is shown:
ChromaticityPlot["RGB"]ChromaticityPlot["RGB", WhitePoint -> None]White points for multiple spaces:
ChromaticityPlot[{"RGB", "WideGamutRGB"}]ChromaticityPlot["RGB", WhitePoint -> "E"]Show all supported daylight white points:
ChromaticityPlot["RGB", WhitePoint -> {"D50", "D55", "D65", "D75"}]Applications (2)
Compare built-in CMYK and an imported CMYK color profile:
profile = Import[FindFile["USWebCoatedSWOP.icc"]];ChromaticityPlot[{"CMYK", profile}, {"CIE76", .3}]Visualize colors in the rainbow color scheme:
t = Table[ColorData["Rainbow"][i], {i, 0, 1, 1 / 1000}];ChromaticityPlot[t]Properties & Relations (1)
Adobe RGB was designed to include most of the colors in the printers' gamuts:
cmyk = Import[FindFile["USWebCoatedSWOP.icc"]];Table[ChromaticityPlot[{cmyk, "AdobeRGB"}, {"CIE31", l}, PlotLegends -> None], {l, {0.2, 0.5}}]Notice that the sRGB space does not include parts of the U.S. Web coated CMYK space at luminance 0.2:
ChromaticityPlot[{cmyk, "RGB"}, {"CIE31", 0.2}]Text
Wolfram Research (2014), ChromaticityPlot, Wolfram Language function, https://reference.wolfram.com/language/ref/ChromaticityPlot.html (updated 2019).
CMS
Wolfram Language. 2014. "ChromaticityPlot." Wolfram Language & System Documentation Center. Wolfram Research. Last Modified 2019. https://reference.wolfram.com/language/ref/ChromaticityPlot.html.
APA
Wolfram Language. (2014). ChromaticityPlot. Wolfram Language & System Documentation Center. Retrieved from https://reference.wolfram.com/language/ref/ChromaticityPlot.html