


ImageWaveformPlot
ImageWaveformPlot[image]
plots the waveform of image.
ImageWaveformPlot[image,colorspace]
plots the waveform of image in colorspace.
ImageWaveformPlot[image,channel]
plots the waveform for the specified channel.
Details and Options
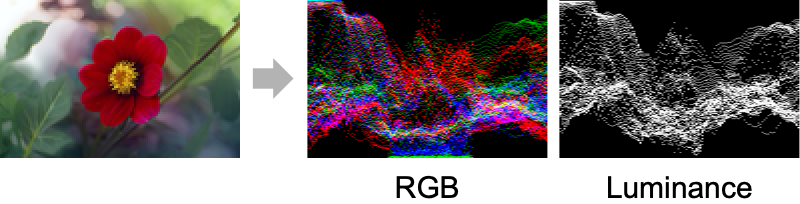
- ImageWaveformPlot is typically used to evaluate and adjust the brightness or colors of an image or frames of a video.
- In an image waveform, the columns correspond to image columns, the rows correspond to the pixel levels, and the intensity of a point corresponds to the count of pixels at that level.
- Use ImageHistogram to compute the histogram of the whole image and use ImageVectorscopePlot to evaluate and adjust hue and saturation.
- The following colorspace specifications can be given:
-
"RGB" red, green, blue (default) "CMYK" cyan, magenta, yellow, black "HSB" hue, saturation, brightness "XYZ" channels of the CIE  color space
"LAB" channels of the CIE  color space
"LCH" channels of the CIE 

 color space
"LUV" channels of the CIE  color space
Automatic channels of the image color space - The channel specification can be one of the following:
-
"I" gray-level (intensity) "L" luminance channel of Lab "R","G","B" red, green, blue from RGB "C","M","Y","K" cyan, magenta, yellow, black from CMYK "H","S","V" hue, saturation, brightness (value) from HSB "Average" mean of all channels "A" alpha channel - For images with some transparency, the alpha channel is used as a weight for the corresponding pixel.
- ImageWaveformPlot has the same options as Graphics, with the following additions and changes: [List of all options]
-
AspectRatio 1/GoldenRatio the default point in the graphic to align with Frame True whether to put a frame around the plot GridLines Automatic grid lines to draw Masking All the region of interest MaxPlotPoints Automatic the maximum number of samples to show PlotLayout "Overlaid" the layout to be used PlotRange Automatic range of values to include ScalingFunctions Automatic how to scale the level counts - Possible settings for PlotLayout include:
-
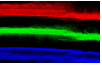
"Column" waveform of channels in a column 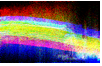
"Overlaid" overlaid waveforms of the channels 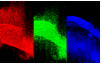
"Row" waveform of channels in a row (RGB parade)
List of all options
Examples
open all close allBasic Examples (1)
Scope (3)
Options (40)
AspectRatio (4)
By default, the ratio of the height to width for the plot is determined automatically:
ImageWaveformPlot[[image]]Make the height the same as the width with AspectRatio1:
ImageWaveformPlot[[image], AspectRatio -> 1]AspectRatioAutomatic determines the ratio from the plot ranges:
ImageWaveformPlot[[image], AspectRatio -> Automatic]AspectRatioFull adjusts the height and width to tightly fit inside other constructs:
plot = ImageWaveformPlot[[image], AspectRatio -> Full];{Framed[Pane[plot, {50, 100}]], Framed[Pane[plot, {100, 100}]], Framed[Pane[plot, {100, 50}]]}Axes (3)
By default, ImageWaveformPlot uses a frame instead of axes:
ImageWaveformPlot[[image]]ImageWaveformPlot[[image], Frame -> False, Axes -> True]Turn on each axis individually:
{ImageWaveformPlot[[image], Frame -> False, Axes -> {True, False}], ImageWaveformPlot[[image], Frame -> False, Axes -> {False, True}]}AxesLabel (3)
No axes labels are drawn by default:
ImageWaveformPlot[[image], Frame -> False, Axes -> True]ImageWaveformPlot[[image], Frame -> False, Axes -> True, AxesLabel -> y]ImageWaveformPlot[[image], Frame -> False, Axes -> True, AxesLabel -> {x, y}]AxesOrigin (2)
AxesStyle (4)
Change the style for the axes:
ImageWaveformPlot[[image], "CMYK", Frame -> False, Axes -> True, AxesStyle -> Red]Specify the style of each axis:
ImageWaveformPlot[[image], "CMYK", Frame -> False, Axes -> True, AxesStyle -> {{Thick, Brown}, {Thick, Blue}}]Use different styles for the ticks and the axes:
ImageWaveformPlot[[image], "CMYK", Frame -> False, Axes -> True, AxesStyle -> Green, TicksStyle -> Blue]Use different styles for the labels and the axes:
ImageWaveformPlot[[image], "CMYK", Frame -> False, Axes -> True, AxesStyle -> Green, LabelStyle -> Blue]Frame (4)
ImageWaveformPlot uses a frame by default:
ImageWaveformPlot[[image], "CMYK"]Use FrameFalse to not draw any frame:
ImageWaveformPlot[[image], "CMYK", Frame -> False]Draw a frame on the left and right edges:
ImageWaveformPlot[[image], "CMYK", Frame -> {{True, True}, {False, False}}]Draw a frame on the left and bottom edges:
ImageWaveformPlot[[image], "CMYK", Frame -> {{True, False}, {True, False}}]FrameLabel (4)
Place a label along the bottom frame of a plot:
ImageWaveformPlot[[image], "CMYK", Frame -> True, FrameLabel -> {"label"}]Frame labels are placed on the bottom and left frame edges by default:
ImageWaveformPlot[[image], "CMYK", Frame -> True, FrameLabel -> {"bottom", "left"}]Place labels on each of the edges in the frame:
ImageWaveformPlot[[image], "CMYK", Frame -> True, FrameLabel -> {{"left", "right"}, {"bottom", "top"}}]Use a customized style for both labels and frame tick labels:
ImageWaveformPlot[[image], "CMYK", Frame -> True, FrameLabel -> {{"left", "right"}, {"bottom", "top"}}, LabelStyle -> Directive[Bold, StandardGray]]FrameStyle (2)
Specify the style of the frame:
ImageWaveformPlot[[image], "CMYK", Frame -> True, FrameStyle -> Directive[Blue, Thick]]Specify the style for each frame edge:
ImageWaveformPlot[[image], "CMYK", Frame -> True, FrameStyle -> {{Directive[Green, Thick], Red}, {Directive[Gray, Thick], Blue}}]FrameTicksStyle (3)
By default, the frame ticks and frame tick labels use the same styles as the frame:
ImageWaveformPlot[[image], "CMYK", Frame -> True, FrameStyle -> Directive[Red]]Specify an overall style for the ticks, including the labels:
ImageWaveformPlot[[image], "CMYK", Frame -> True, FrameStyle -> Directive[Red], FrameTicks -> All, FrameTicksStyle -> Directive[Blue, Thick]]Use different style for the different frame edges:
ImageWaveformPlot[[image], "CMYK", Frame -> True, FrameStyle -> Directive[Red], FrameTicks -> All, FrameTicksStyle -> {{Directive[Orange, Thick], Blue}, {Directive[Orange, Thick], Green}}]ImageSize (7)
Use named sizes such as Tiny, Small, Medium and Large:
{ImageWaveformPlot[[image], ImageSize -> Tiny], ImageWaveformPlot[[image], ImageSize -> Small]}Specify the width of the plot:
{ImageWaveformPlot[[image], ImageSize -> 150], ImageWaveformPlot[[image], AspectRatio -> 1.5, ImageSize -> 150]}Specify the height of the plot:
{ImageWaveformPlot[[image], ImageSize -> {Automatic, 150}], ImageWaveformPlot[[image], AspectRatio -> 2, ImageSize -> {Automatic, 150}]}Allow the width and height to be up to a certain size:
{ImageWaveformPlot[[image], ImageSize -> UpTo[200]], ImageWaveformPlot[[image], AspectRatio -> 2, ImageSize -> UpTo[200]]}Specify the width and height for a graphic, padding with space if necessary:
ImageWaveformPlot[[image], ImageSize -> {200, 200}, Background -> StandardGray]Setting AspectRatioFull will fill the available space:
ImageWaveformPlot[[image], AspectRatio -> Full, ImageSize -> {200, 200}, Background -> StandardGray]Use maximum sizes for the width and height:
{ImageWaveformPlot[[image], ImageSize -> {UpTo[150], UpTo[100]}], ImageWaveformPlot[[image], AspectRatio -> 2, ImageSize -> {UpTo[150], UpTo[100]}]}Use ImageSizeFull to fill the available space in an object:
Framed[Pane[ImageWaveformPlot[[image], ImageSize -> Full, Background -> StandardGray], {200, 100}]]Specify the image size as a fraction of the available space:
Framed[Pane[ImageWaveformPlot[[image], AspectRatio -> Full, ImageSize -> {Scaled[0.5], Scaled[0.5]}, Background -> StandardGray], {200, 100}]]Masking (2)
By default, the whole image is processed:
i = [image];ImageWaveformPlot[i]Specify the region of interest using a mask:
ImageWaveformPlot[i, Masking -> [image]]If present, the alpha channel is used as a mask:
i = [image];ImageWaveformPlot[i]This is equivalent to using the image alpha channel as the mask:
ImageWaveformPlot[RemoveAlphaChannel@i, Masking -> AlphaChannel@i]When both transparency and a mask are present, the corresponding pixel values are multiplied:
ImageWaveformPlot[i, Masking -> AlphaChannel@i]PlotLayout (1)
Text
Wolfram Research (2020), ImageWaveformPlot, Wolfram Language function, https://reference.wolfram.com/language/ref/ImageWaveformPlot.html.
CMS
Wolfram Language. 2020. "ImageWaveformPlot." Wolfram Language & System Documentation Center. Wolfram Research. https://reference.wolfram.com/language/ref/ImageWaveformPlot.html.
APA
Wolfram Language. (2020). ImageWaveformPlot. Wolfram Language & System Documentation Center. Retrieved from https://reference.wolfram.com/language/ref/ImageWaveformPlot.html