

PlotLayout
is an option for plotting functions that specifies the layout of multiple components in a plot.
Details
- PlotLayout determines how visual elements are placed relative to each other.
- Common settings for PlotLayout include:
-
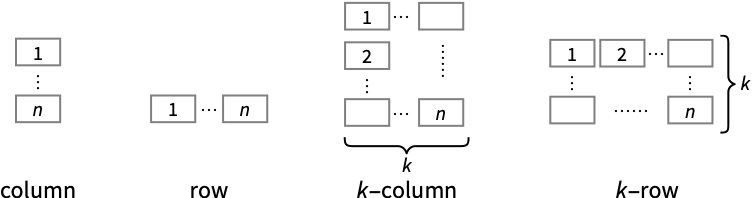
"Overlaid" allow the elements to overlap "Stacked" accumulate the values across elements "Percentile" accumulate and normalize the values across elements - Possible settings for PlotLayout that spread the plot elements across multiple plot panels include:
-
"Column" use a column of panels "Row" use a row of panels {"Column",k},{"Row",k} use k columns or rows {"Column",UpTo[k]},{"Row",UpTo[k]} use at most k columns or rows - Visualization functions for specialized domains may have alternative settings.
Examples
open all close allBasic Examples (5)
By default, ListLinePlot plots each curve independently:
ListLinePlot[{{1, 4, 3, 2, 5, 9, 7}, {5, 6, 5, 4, 5, 7, 5}}]Stack the curves so that the second curve is the total of the first and second sets:
ListLinePlot[{{1, 4, 3, 2, 5, 9, 7}, {5, 6, 5, 4, 5, 7, 5}}, PlotLayout -> "Stacked"]Plot curves using a percentile layout:
ListLinePlot[{{1, 4, 3, 2, 5, 9, 7}, {5, 6, 5, 4, 5, 7, 5}}, PlotLayout -> "Percentile"]ListLinePlot[{{1, 4, 3, 2, 5, 9, 7}, {5, 6, 5, 4, 5, 7, 5}}, PlotLayout -> "Row"]ListLinePlot[{{1, 4, 3, 2, 5, 9, 7}, {5, 6, 5, 4, 5, 7, 5}}, PlotLayout -> "Column"]Scope (8)
Use a stacked layout for point data:
ListPlot[{{1, 4, 3, 2, 5, 9, 7}, {5, 6, 5, 4, 5, 7, 5}}, PlotLayout -> "Stacked", Filling -> Bottom]Use a stacked layout for piecewise-constant data:
ListStepPlot[{{1, 4, 3, 2, 5, 9, 7}, {5, 6, 5, 4, 5, 7, 5}}, PlotLayout -> "Stacked"]Show multiple density plots in a row:
DensityPlot[{Sin[x]Cos[y], Sin[y]Cos[x]}, {x, 0, 10}, {y, 0, 10}, PlotLayout -> "Row"]Plot[{BesselJ[0, x], BesselJ[1, x], BesselJ[2, x], BesselJ[3, x], BesselJ[4, x], BesselJ[5, x]}, {x, 0, 20}, PlotLayout -> {"Column", 3}, PlotLabels -> "Expressions"]Plot[{BesselJ[0, x], BesselJ[1, x], BesselJ[2, x], BesselJ[3, x], BesselJ[4, x], BesselJ[5, x]}, {x, 0, 20}, PlotLayout -> {"Row", 2}, PlotLabels -> "Expressions"]Specify the layout of plots of a list of audio objects:
list = {ExampleData[{"Audio", "Scream"}], ExampleData[{"Audio", "ChurchBell"}]};AudioPlot[list, PlotLayout -> "Vertical"]AudioPlot[list, PlotLayout -> "Overlaid"]Plot against a common horizontal axis:
dwd = StationaryWaveletTransform[Sin[Range[30]^2 / 50], Automatic, 3]WaveletListPlot[dwd, PlotLayout -> "CommonXAxis"]Plot against a common vertical axis:
WaveletListPlot[dwd, PlotLayout -> "CommonYAxis"]Show wavelet image coefficients arranged in a pyramid layout:
dwd = DiscreteWaveletTransform[[image], SymletWavelet[3], 3];WaveletImagePlot[dwd, PlotLayout -> "Pyramid"]Plot wavelet image coefficients in a grid layout:
WaveletImagePlot[dwd, PlotLayout -> "Grid"]Place the magnitude plot vertically above the phase plot:
tfm = TransferFunctionModel[{{{-5 + s}},
s*(1 + 3*s + s^2)}, s];BodePlot[tfm, PlotLabel -> {"Magnitude Plot", "Phase Plot"}, PlotLayout -> "VerticalGrid"]BodePlot[tfm, PlotLayout -> "List", PlotLabel -> {"Magnitude Plot", "Phase Plot"}]BodePlot[tfm, PlotLayout -> "Magnitude", PlotLabel -> "Magnitude Plot"]BodePlot[tfm, PlotLayout -> "Phase", PlotLabel -> "Phase Plot"]Text
Wolfram Research (2010), PlotLayout, Wolfram Language function, https://reference.wolfram.com/language/ref/PlotLayout.html (updated 2017).
CMS
Wolfram Language. 2010. "PlotLayout." Wolfram Language & System Documentation Center. Wolfram Research. Last Modified 2017. https://reference.wolfram.com/language/ref/PlotLayout.html.
APA
Wolfram Language. (2010). PlotLayout. Wolfram Language & System Documentation Center. Retrieved from https://reference.wolfram.com/language/ref/PlotLayout.html