


WaveletMatrixPlot
WaveletMatrixPlot[dwd]
plots the basis tree of wavelet matrix coefficients in the DiscreteWaveletData dwd.
WaveletMatrixPlot[dwd,r]
plots coefficients up to refinement level r.
WaveletMatrixPlot[dwd,r,func]
applies func to coefficients before plotting.
Details and Options

- WaveletMatrixPlot generates a single plot using a pyramid of matrix plots.
- WaveletMatrixPlot[dwd] is equivalent to WaveletMatrixPlot[dwd,Automatic], corresponding to the basis of coefficients used in the InverseWaveletTransform.
- The wavelet indices used in the Automatic setting are given by dwd["BasisIndex"].
- The dwd should be generated from matrix data and produced by DiscreteWaveletTransform, DiscreteWaveletPacketTransform, or LiftingWaveletTransform.
- WaveletMatrixPlot[dwd,r] plots basis coefficients up to refinement level r when dwd comes from DiscreteWaveletTransform or LiftingWaveletTransform.
- WaveletMatrixPlot[dwd,r] plots all coefficients at refinement level r when dwd comes from DiscreteWaveletPacketTransform.
- In WaveletMatrixPlot[dwd,r,func], each func[coefi,windi] should yield an array with the same dimensions as coefi.
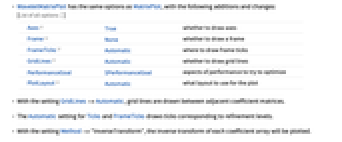
- WaveletMatrixPlot has the same options as MatrixPlot, with the following additions and changes: [List of all options]
-
Axes True whether to draw axes Frame None whether to draw a frame FrameTicks Automatic where to draw frame ticks GridLines Automatic whether to draw grid lines PerformanceGoal $PerformanceGoal aspects of performance to try to optimize PlotLayout Automatic what layout to use for the plot - With the setting GridLines->Automatic, grid lines are drawn between adjacent coefficient matrices.
- The Automatic setting for Ticks and FrameTicks draws ticks corresponding to refinement levels.
- With the setting Method->"InverseTransform", the inverse transform of each coefficient array will be plotted.
- WaveletMatrixPlot returns a Graphics object.
-
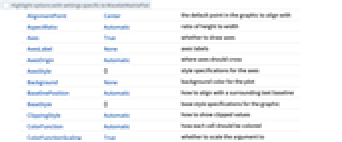
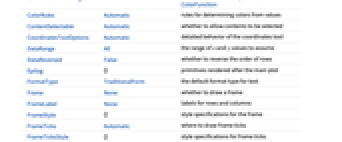
AlignmentPoint Center the default point in the graphic to align with AspectRatio Automatic ratio of height to width Axes True whether to draw axes AxesLabel None axes labels AxesOrigin Automatic where axes should cross AxesStyle {} style specifications for the axes Background None background color for the plot BaselinePosition Automatic how to align with a surrounding text baseline BaseStyle {} base style specifications for the graphic ClippingStyle Automatic how to show clipped values ColorFunction Automatic how each cell should be colored ColorFunctionScaling True whether to scale the argument to ColorFunction ColorRules Automatic rules for determining colors from values ContentSelectable Automatic whether to allow contents to be selected CoordinatesToolOptions Automatic detailed behavior of the coordinates tool DataRange All the range of  and
and  values to assume
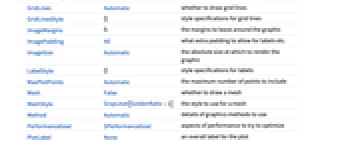
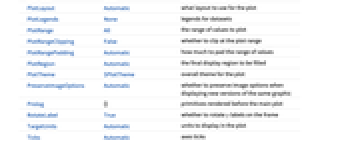
 DataReversed False whether to reverse the order of rows Epilog {} primitives rendered after the main plot FormatType TraditionalForm the default format type for text Frame None whether to draw a frame FrameLabel None labels for rows and columns FrameStyle {} style specifications for the frame FrameTicks Automatic where to draw frame ticks FrameTicksStyle {} style specifications for frame ticks GridLines Automatic whether to draw grid lines GridLinesStyle {} style specifications for grid lines ImageMargins 0. the margins to leave around the graphic ImagePadding All what extra padding to allow for labels etc. ImageSize Automatic the absolute size at which to render the graphic LabelStyle {} style specifications for labels MaxPlotPoints Automatic the maximum number of points to include Mesh False whether to draw a mesh MeshStyle GrayLevel[GoldenRatio-1] the style to use for a mesh Method Automatic details of graphics methods to use PerformanceGoal $PerformanceGoal aspects of performance to try to optimize PlotLabel None an overall label for the plot PlotLayout Automatic what layout to use for the plot PlotLegends None legends for datasets PlotRange All the range of values to plot PlotRangeClipping False whether to clip at the plot range PlotRangePadding Automatic how much to pad the range of values PlotRegion Automatic the final display region to be filled PlotTheme $PlotTheme overall theme for the plot PreserveImageOptions Automatic whether to preserve image options when displaying new versions of the same graphic Prolog {} primitives rendered before the main plot RotateLabel True whether to rotate y labels on the frame TargetUnits Automatic units to display in the plot Ticks Automatic axes ticks TicksStyle {} style specifications for axes ticks
List of all options
Examples
open all close allBasic Examples (2)
Scope (11)
Data (6)
DiscreteWaveletTransform of matrix data:
Plot matrix wavelet coefficients in a hierarchical grid with wavelet index as a tooltip:
The plotted coefficients are the Automatic coefficients used in the inverse transform:
Use WaveletMatrixPlot[dwd,r] to plot coefficients only up to refinement level r:
The hierarchical layout corresponds to the tree structure of the wavelet coefficients:
DiscreteWaveletPacketTransform of matrix data:
The DiscreteWaveletData object contains a full tree of coefficients at each level:
Default Automatic coefficients for packet transform correspond to the highest refinement level:
WaveletBestBasis computes a different Automatic tree of coefficients:
Specify a function f to apply to wavelet coefficients before plotting:
"Grid" layout is used to plot coefficients from StationaryWaveletTransform:
Generalizations & Extensions (3)
Plot rectangular coefficients in a hierarchical grid layout:
DiscreteWaveletTransform of complex data:
Specify a real-valued function to apply to complex data before plotting:
By default, Re is applied:
Options (30)
AspectRatio (1)
Specify AspectRatio to adjust the ratio of height and width of the plot:
ColorFunction (1)
FrameTicks (2)
GridLines (1)
GridLinesStyle (1)
ImageSize (7)
Use named sizes such as Tiny, Small, Medium and Large:
Specify the width of the plot:
Specify the height of the plot:
Allow the width and height to be up to a certain size:
Specify the width and height for a graphic, padding with space if necessary:
Setting AspectRatioFull will fill the available space:
Use maximum sizes for the width and height:
Use ImageSizeFull to fill the available space in an object:
Specify the image size as a fraction of the available space:
Method (1)
PlotLegends (3)
Ticks (5)
Properties & Relations (4)
WaveletMatrixPlot plots matrix wavelet coefficients in a hierarchical grid layout:
dwd[…,"MatrixPlot"] gives each coefficient as a separate matrix plot:
WaveletMatrixPlot plots the Automatic coefficients used in the inverse transform:
WaveletBestBasis selects a different default tree of coefficients:
WaveletImagePlot shows image wavelet coefficients in a hierarchical grid:
WaveletScalogram plots vector coefficients with numerical magnitude indicated by color:
WaveletListPlot plots vector coefficients with a common horizontal or vertical axis:
Text
Wolfram Research (2010), WaveletMatrixPlot, Wolfram Language function, https://reference.wolfram.com/language/ref/WaveletMatrixPlot.html (updated 2014).
CMS
Wolfram Language. 2010. "WaveletMatrixPlot." Wolfram Language & System Documentation Center. Wolfram Research. Last Modified 2014. https://reference.wolfram.com/language/ref/WaveletMatrixPlot.html.
APA
Wolfram Language. (2010). WaveletMatrixPlot. Wolfram Language & System Documentation Center. Retrieved from https://reference.wolfram.com/language/ref/WaveletMatrixPlot.html