Visualization Gallery
Visualization Gallery
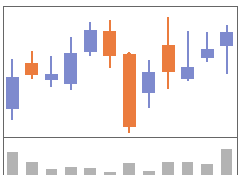
Select from hundreds of built-in Wolfram Language symbols to construct graphs and plots to best represent your data. Some options are automated for ease of use, but all can be customized.
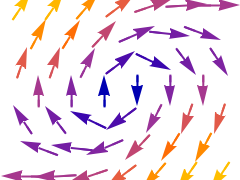
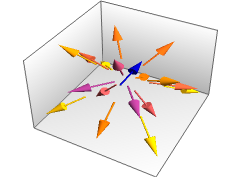
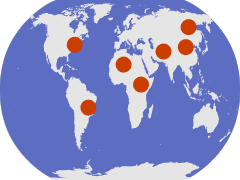
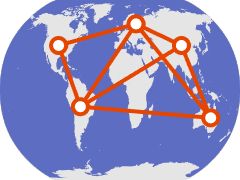
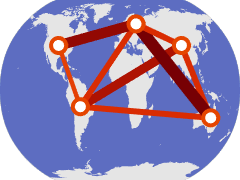
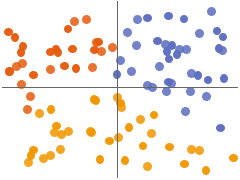
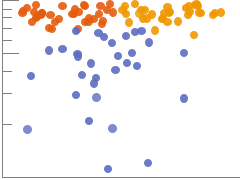
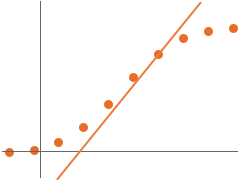
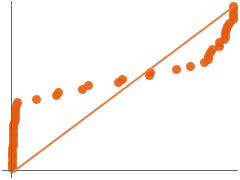
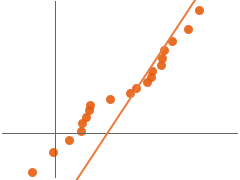
Points
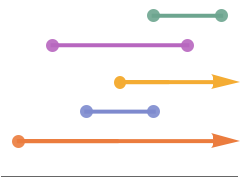
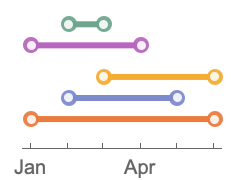
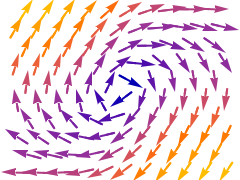
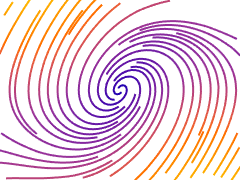
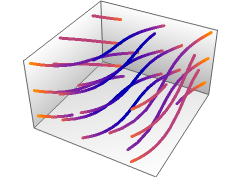
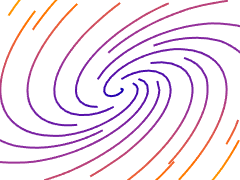
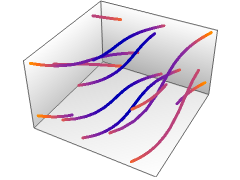
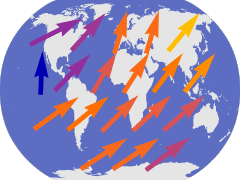
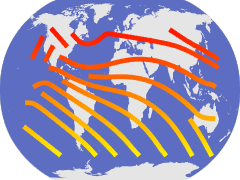
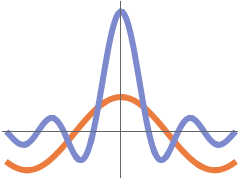
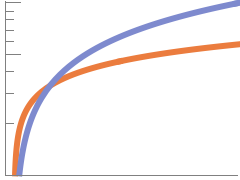
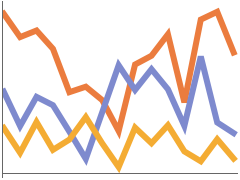
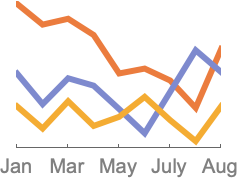
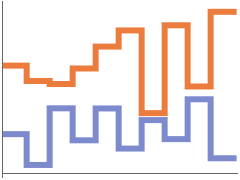
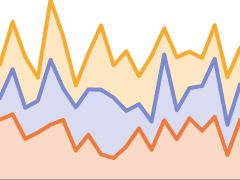
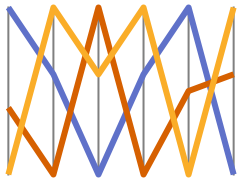
Lines
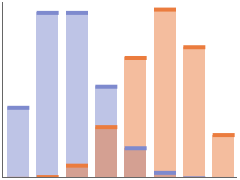
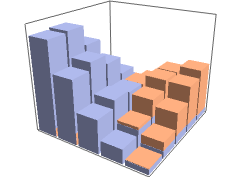
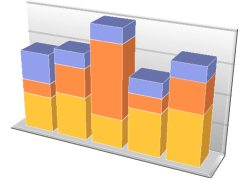
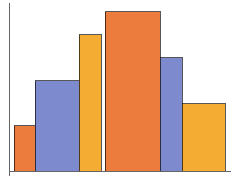
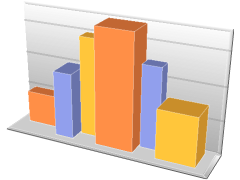
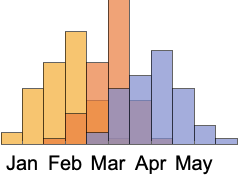
Bars


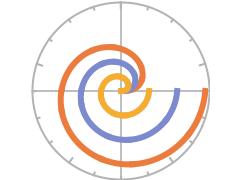
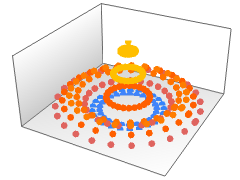
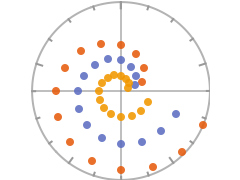
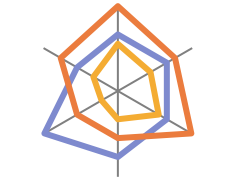
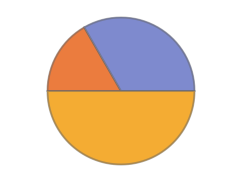
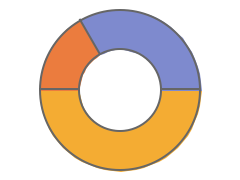
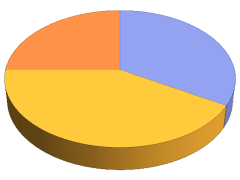
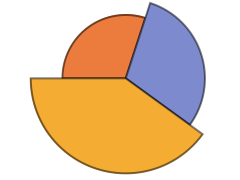
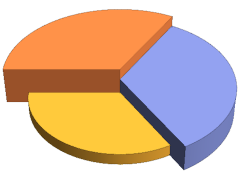
Sectors
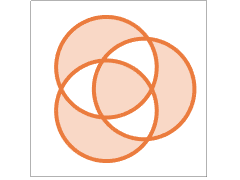
Visualize how parts contribute to the whole with Pie and Sector plot options

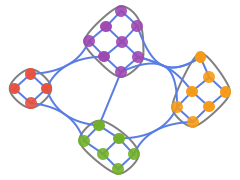
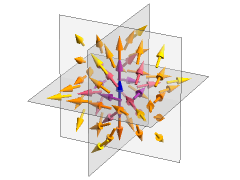
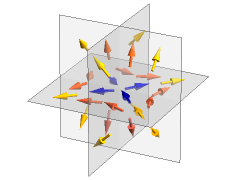
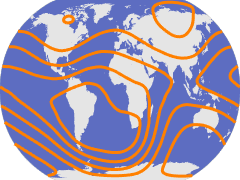
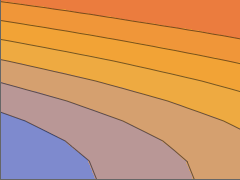
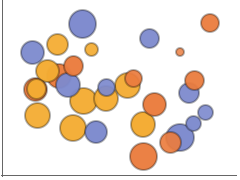
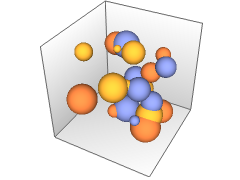
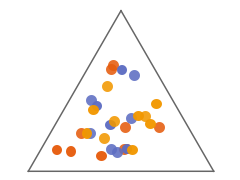
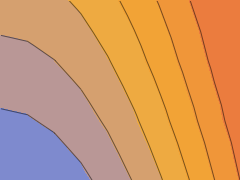
Regions

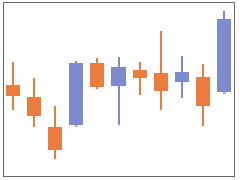
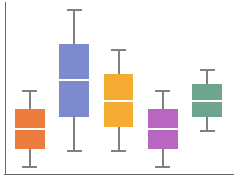
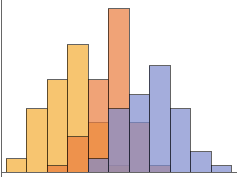
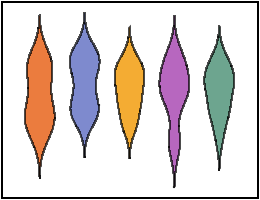
Statistical Plots
Represent statistical data including histograms and distributions


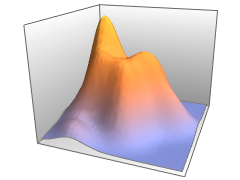
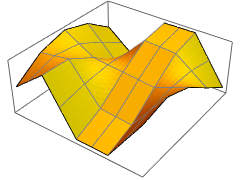
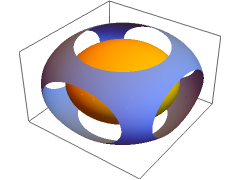
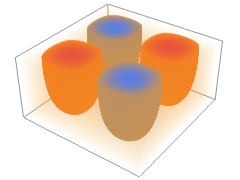
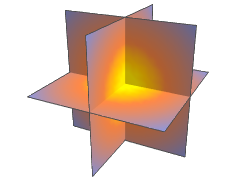
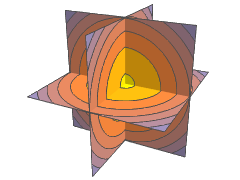
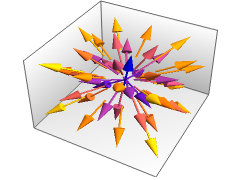
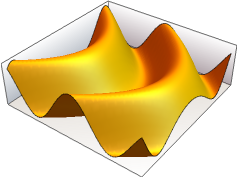
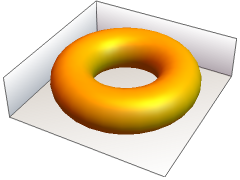
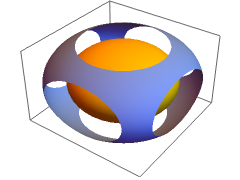
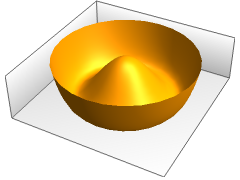
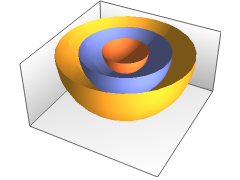
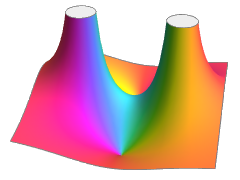
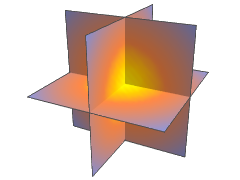
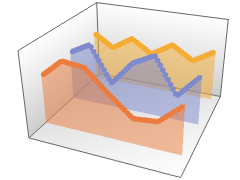
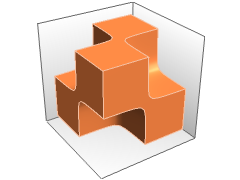
Surfaces
Create and customize high-resolution, interactive 3D surface plots