


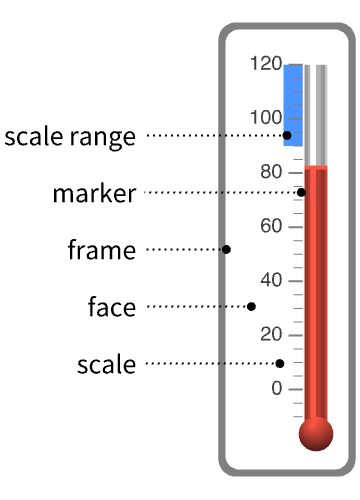
ThermometerGauge
ThermometerGauge[value]
draws a thermometer showing value in a range of 0 to 1.
ThermometerGauge[value,{min,max}]
draws a thermometer showing value in a range of min to max.
ThermometerGauge[Dynamic[value],…]
allows value to be set interactively using the thermometer.
Details and Options
- Values less than min or greater than max are clipped to the respective limits.
- Undefined values or bad input is taken to be missing and typically displays the min value.
- Units may be assigned to value, min, and max by using Quantity.
- The units do not need to be the same, but must be commensurate.
- ThermometerGauge has the same options as Graphics, with the following additions and changes: [List of all options]
-
GaugeFaceElementFunction Automatic function to draw the face GaugeFaceStyle Automatic style for the gauge face GaugeFrameElementFunction Automatic function to draw the frame GaugeFrameSize Automatic how large to make the gauge frame GaugeFrameStyle Automatic style for the gauge frame GaugeLabels Automatic labels for the gauge GaugeMarkers Automatic appearance for the marker GaugeStyle Automatic style for gauge markers Method Automatic method to use PerformanceGoal $PerformanceGoal aspects of performance to try to optimize PlotTheme $PlotTheme theme to use for drawing the gauge ScaleDivisions Automatic the number and distribution of ticks ScaleOrigin Automatic where to position the scale in the gauge ScalePadding Automatic how to draw the space around the scale ScaleRanges None the sections of the scale to be styled ScaleRangeStyle Automatic how to draw the scale ranges ScalingFunctions None scaling functions for the gauge TargetUnits Automatic units to display in the gauge - GaugeLabels can take the following forms:
-
None no gauge labels Automatic include units as labels Full include units and a value as labels All include all values as labels "Value" include values as labels "Unit" include units as labels label use label as a label Placed[label,pos] place label at position pos {label1,label2,…} use multiple labels - GaugeLabels->Placed[label,pos] can use the positions pos:
-
Top,Bottom,Left,Right,Center positions within the dial bs position along the scale Scaled[bs] scaled position along the scale {bx,by} scaled position {bx,by} in the gauge {pos,{lx,ly}} scaled position {lx,ly} in the label at general position pos in the gauge - ScalePadding can take the following forms:
-
p the same horizontal and vertical padding {pr,py} different horizontal and vertical padding {{px left,px right},…} different padding on each side of the  axis etc.
 - ThermometerGauge by default uses a filled liquid appearance for the marker.
- TargetUnits->Automatic automatically selects the units based on the input. If no units are present, none will be displayed.
- TargetUnits->unit displays unit in the gauge, even if no units were present in the input.
List of all options
Examples
open all close allBasic Examples (2)
Scope (15)
Data and Layouts (4)
Data values do not have to be within the range of the scale:
{ThermometerGauge[-500, {0, 100}], ThermometerGauge[146.8, {0, 100}]}Nonreal data is taken to be missing and uses the minimum value of the gauge:
Table[ThermometerGauge[a, {0, 10}],
	{a, {2 + 2I, "Hi"}}]
The min and max specified are sorted so that the smaller number of the list is always the min:
{ThermometerGauge[42, {100, 0}], ThermometerGauge[-42, {50, -50}]}Specify temperatures using units:
ThermometerGauge[Quantity[76, "Fahrenheit"], Quantity[{-25, 100}, "Fahrenheit"], GaugeLabels -> "Unit"]Specify the displayed units with TargetUnits:
ThermometerGauge[Quantity[76, "Fahrenheit"], Quantity[{-25, 100}, "Fahrenheit"], TargetUnits -> "°C", GaugeLabels -> "Unit"]Styling and Appearance (5)
Use a theme to control the overall appearance:
ThermometerGauge[42, {0, 100}, PlotTheme -> "Web"]Use explicit styles for the markers:
ThermometerGauge[20, {0, 100}, GaugeStyle -> Blue]Change the face style for the gauge:
Table[ThermometerGauge[20, {0, 100}, GaugeFaceStyle -> s], {s, {LightGray, {White, EdgeForm[{Thick, Gray}]}}}]Change the style of the frame around the gauge:
Table[ThermometerGauge[20, {0, 100}, GaugeFrameStyle -> s], {s, {LightGray, {White, EdgeForm[{Thick, Gray}]}}}]Specify ranges of the scale to be colored by the index on the dial face:
ThermometerGauge[20, {0, 100}, ScaleRanges -> {{50, 60}, {60, 75}, {75, 90}, {90, 100}}]Labeling and Legending (6)
Use GaugeLabels to add a label to the gauge face:
ThermometerGauge[20, {0, 100}, GaugeLabels -> "Inside"]Add a display of the scale value:
ThermometerGauge[20, {0, 100}, GaugeLabels -> "Value"]Add a display of the thermometer units:
ThermometerGauge[Quantity[20, "Celsius"], {0, 100}, GaugeLabels -> "Unit"]ThermometerGauge[Quantity[20, "Celsius"], {0, 100}, GaugeLabels -> Full]Use Placed to change the location of the label on the face of the gauge:
ThermometerGauge[20, {0, 100}, GaugeLabels -> Placed["Outside", Left]]Add multiple labels to the gauge face:
ThermometerGauge[20, {0, 100}, TargetUnits -> "°C", GaugeLabels -> {"Unit", "Value", "Outside"}]Options (58)
AspectRatio (2)
By default, the ratio of the height to width for the plot is determined automatically:
ThermometerGauge[20, {0, 100}, GaugeFrameStyle -> Gray]Make the height the same as the width with AspectRatio1:
ThermometerGauge[20, {0, 100}, GaugeFrameStyle -> Gray, AspectRatio -> 1]Background (1)
Insert a background color behind the gauge:
ThermometerGauge[20, {0, 100}, GaugeFrameStyle -> Gray, Background -> LightBlue]Use GaugeFaceStyle to set the face style:
ThermometerGauge[20, {0, 100}, GaugeFrameStyle -> Gray, GaugeFaceStyle -> LightBlue]GaugeFaceElementFunction (3)
List built-in settings for GaugeFaceElementFunction:
ChartElementData["ThermometerGauge", "Face"]For detailed settings use Palettes ▶ ChartElementSchemes:
Table[ThermometerGauge[20, {0, 100}, PlotLabel -> f, GaugeFaceStyle -> LightBlue, GaugeFaceElementFunction -> f], {f, {"FadingRectangle", "GlassRectangle", "GradientScaleRectangle"}}]Write a custom GaugeFaceElementFunction:
g[{{xmin_, xmax_}, {ymin_, ymax_}}, ___] := Rectangle[{xmin, ymin}, {xmax, ymax}, RoundingRadius -> 0]ThermometerGauge[20, {0, 100}, GaugeFaceStyle -> LightOrange, GaugeFaceElementFunction -> g]GaugeFaceStyle (3)
Specify the style for the gauge face:
Table[ThermometerGauge[20, {0, 100}, GaugeFaceStyle -> c], {c, {White, LightGray, LightOrange, LightBlue}}]Use None to turn off the face:
ThermometerGauge[20, {0, 100}, GaugeFaceStyle -> None, GaugeFrameStyle -> Gray, Background -> LightBlue]Use a Texture as a gauge face:
ThermometerGauge[20, {0, 100}, AxesStyle -> Black, GaugeFrameStyle -> StandardGray, GaugeFaceStyle -> Texture[ExampleData[{"ColorTexture", "Amboyna"}]]]GaugeFrameElementFunction (2)
List built-in settings for GaugeFrameElementFunction:
ChartElementData["ThermometerGauge", "Frame"]For detailed settings, use Palettes ▶ ChartElementSchemes:
Table[ThermometerGauge[20, {0, 100}, GaugeFrameElementFunction -> i, PlotLabel -> i], {i, {"FadingRectangle", "GradientScaleRectangle", "SegmentScaleRectangle"}}]GaugeFrameSize (3)
Use an explicit width in the graphics coordinate system to draw the frame:
{ThermometerGauge[20, {0, 100}, GaugeFrameSize -> .1],
	ThermometerGauge[20, {0, 100}, GaugeFrameSize -> .02]}
Use None to turn off the frame:
ThermometerGauge[20, {0, 100}, GaugeFrameSize -> None]Use named sizes for the frame:
ThermometerGauge[20, {0, 100}, GaugeFrameSize -> #]& /@ {Tiny, Small , Medium, Large}GaugeFrameStyle (1)
GaugeLabels (6)
ThermometerGauge[20, {0, 100}, GaugeLabels -> "Value"]ThermometerGauge[20, {0, 100}, GaugeLabels -> "Current"]Table[ThermometerGauge[20, {0, 100}, GaugeLabels -> label], {label, {Sqrt[x^x], [image], [image]}}]Use Placed to control label placement:
Table[ThermometerGauge[20, {0, 100}, GaugeLabels -> Placed["Value", p]], {p, {Left, Top, Right}}]Use a scaled coordinate system over the entire gauge:
Table[ThermometerGauge[20, {0, 100}, GaugeLabels -> Placed["Value", p]], {p, {{0.35, 0.5}, {0.1, 0.9}, {0.5, 0.65}}}]Use a list to specify more than one label:
ThermometerGauge[20, {0, 100}, GaugeLabels -> {"Unit", Placed[
    Rotate["Outside", -π / 2], {.9, .5}]}, TargetUnits -> "°C"]
GaugeStyle (1)
ImageSize (7)
Use named sizes such as Tiny, Small, Medium and Large:
{ThermometerGauge[20, {0, 100}, GaugeFrameStyle -> Gray, ImageSize -> Tiny], ThermometerGauge[20, {0, 100}, GaugeFrameStyle -> Gray, ImageSize -> Small]}Specify the width of the plot:
{ThermometerGauge[20, {0, 100}, GaugeFrameStyle -> Gray, ImageSize -> 80], ThermometerGauge[20, {0, 100}, GaugeFrameStyle -> Gray, AspectRatio -> 1.5, ImageSize -> 80]}Specify the height of the plot:
{ThermometerGauge[20, {0, 100}, GaugeFrameStyle -> Gray, ImageSize -> {Automatic, 150}], ThermometerGauge[20, {0, 100}, GaugeFrameStyle -> Gray, AspectRatio -> 2, ImageSize -> {Automatic, 150}]}Allow the width and height to be up to a certain size:
{ThermometerGauge[20, {0, 100}, GaugeFrameStyle -> Gray, ImageSize -> UpTo[200]], ThermometerGauge[20, {0, 100}, GaugeFrameStyle -> Gray, AspectRatio -> 2, ImageSize -> UpTo[200]]}Specify the width and height for a graphic, padding with space if necessary:
ThermometerGauge[20, {0, 100}, GaugeFrameStyle -> Gray, ImageSize -> {100, 200}, Background -> LightBlue]Setting AspectRatioFull will fill the available space:
ThermometerGauge[20, {0, 100}, GaugeFrameStyle -> Gray, AspectRatio -> Full, ImageSize -> {100, 200}, Background -> LightBlue]Use maximum sizes for the width and height:
{ThermometerGauge[20, {0, 100}, GaugeFrameStyle -> Gray, ImageSize -> {UpTo[150], UpTo[100]}], ThermometerGauge[20, {0, 100}, GaugeFrameStyle -> Gray, AspectRatio -> 2, ImageSize -> {UpTo[150], UpTo[100]}]}Use ImageSizeFull to fill the available space in an object:
Framed[Pane[ThermometerGauge[20, {0, 100}, GaugeFrameStyle -> Gray, ImageSize -> Full, Background -> LightBlue], {100, 100}]]Specify the image size as a fraction of the available space:
Framed[Pane[ThermometerGauge[20, {0, 100}, GaugeFrameStyle -> Gray, ImageSize -> {Scaled[0.5], Scaled[0.5]}, Background -> LightBlue], {200, 200}]]LabelStyle (1)
PerformanceGoal (3)
Generate a gauge with interaction highlighting and improved aesthetics:
ThermometerGauge[20, {0, 100}, PerformanceGoal -> "Quality"]Turn off interactive highlighting and use a simpler appearance for increased speed:
ThermometerGauge[20, {0, 100}, PerformanceGoal -> "Speed"]Typically, less memory is required for noninteractive charts:
ByteCount /@ {ThermometerGauge[20, {0, 100}, PerformanceGoal -> "Quality"], ThermometerGauge[20, {0, 100}, PerformanceGoal -> "Speed"]}PlotTheme (5)
Create gauges using a variety of base themes:
Multicolumn[Table[Labeled[ThermometerGauge[72, {0, 100}, PlotTheme -> t], t], {t, {"Business", "Detailed", "Marketing", "Minimal", "Monochrome", "Scientific", "Web", "Classic"}}], 4]Specify a theme with minimal elements:
ThermometerGauge[72, {0, 100}, PlotTheme -> "Minimal"]ThermometerGauge[72, {0, 100}, PlotTheme -> "Minimal", GaugeStyle -> {RGBColor[0.1, 0.1, 0.8]}]ThermometerGauge[55, {0, 100}, PlotTheme -> {"Marketing", "BoldColor"}]ThermometerGauge[55, {0, 100}, PlotTheme -> "Monochrome", GaugeFrameStyle -> StandardGray]ScaleDivisions (2)
ScaleRanges (7)
Highlight a range of values on the scale:
ThermometerGauge[42, {0, 100}, ScaleRanges -> {80, 100}]ThermometerGauge[42, {0, 100}, ScaleRanges -> {{50, 75}, {75, 90}, {90, 100}}]Style the entire region behind the scale:
ThermometerGauge[42, {0, 100}, ScaleRangeStyle -> Opacity[.5, Blue], ScaleRanges -> All]Ranges need not be contiguous or distinct:
ThermometerGauge[42, {0, 100}, ScaleRanges -> {{0, 25}, {50, 75}, {75, 100}, {65, 85}}]Directly associate a style with a range with range->style:
ThermometerGauge[42, {0, 100}, ScaleRanges -> {{0, 33} -> Green, {33, 66} -> Yellow, {66, 100} -> Red}]ScaleRanges draws in front of the gauge face:
ThermometerGauge[42, {0, 100}, ScaleRanges -> All, GaugeFaceStyle -> LightGray]ThermometerGauge[17, {0, 100}, ScaleRanges -> {{{0, 33}, .1}, {{33, 66}, .1}, {{66, 100}, .1}}, ScaleRangeStyle -> 24]ThermometerGauge[17, {0, 100}, ScaleRanges -> {{{0, 33}, {0, 0.05}}, {{33, 66}, {0, 0.075}}, {{66, 100}, {0, 0.1}}}, ScaleRangeStyle -> 24]ScaleRangeStyle (7)
By default, scale ranges styles are based on GaugeStyle:
Table[ThermometerGauge[20, {0, 100}, ScaleRanges -> {{50, 70}, {70, 80}, {80, 90}, {90, 100}}, GaugeStyle -> s], {s, {Automatic, Blue, Green, Purple}}]Apply a style to all of the ranges:
ThermometerGauge[20, {0, 100}, ScaleRanges -> {{50, 70}, {70, 80}, {80, 90}, {90, 100}}, ScaleRangeStyle -> EdgeForm[{Gray, Thick}]]Use a list of directives to style the ranges:
ThermometerGauge[20, {0, 100}, ScaleRanges -> {{50, 70}, {70, 80}, {80, 90}, {90, 100}}, ScaleRangeStyle -> {Blue, Green, Orange, Red}]Styles will repeat cyclically if necessary:
ThermometerGauge[20, {0, 100}, ScaleRanges -> Table[{i, i + 10}, {i, 0, 100, 10}], ScaleRangeStyle -> {Yellow, Orange}]Use ScaleRangeStyle->{None,style} to apply a style to the scale only:
ThermometerGauge[20, {0, 100}, ScaleRanges -> {80, 100}, ScaleRangeStyle -> {None, Red}]Apply a style to the backgrounds and foregrounds of all the ranges:
ThermometerGauge[20, {0, 100}, ScaleRanges -> {{0, 20}, {80, 100}}, ScaleRangeStyle -> {{LightBlue, Blue}, {LightRed, Red}}]Color the scale ranges with built-in ColorData gradients:
Table[ThermometerGauge[20, {0, 100}, ScaleRanges -> {{0, 25}, {25, 40}, {55, 40}, {55, 100}}, ScaleRangeStyle -> f], {f, {24, "ThermometerColors"}}]TargetUnits (2)
By default, units are determined automatically:
ThermometerGauge[["43 Celsius"], {["0Celsius"], ["50Celsius"]}, GaugeLabels -> "Unit"]ThermometerGauge[["43 Celsius"], {["0Celsius"], ["50Celsius"]}, GaugeLabels -> "Unit", TargetUnits -> "Fahrenheit"]TicksStyle (2)
Table[ThermometerGauge[20, {0, 100}, TicksStyle -> c], {c, {Green, ColorData[63, 1]}}]Use None to not draw ticks:
ThermometerGauge[20, {0, 100}, TicksStyle -> None]Applications (1)
Monitor recent weather conditions for a location:
data = WeatherData["KMDZ", "Temperature", {Take[DateList[], 3]}];Grid[{{Style["Temperature in Chicago today as of: ", 18], ClockGauge[AbsoluteTime[], ImageSize -> Tiny]}, {Row[{ThermometerGauge[WeatherData["KMDZ", "Temperature"], {-40, 120}, PlotLabel -> "Current", TargetUnits -> "Celsius", GaugeLabels -> Full], DateListPlot[data, Joined -> True, ImageSize -> Medium]}], SpanFromLeft}}]Text
Wolfram Research (2012), ThermometerGauge, Wolfram Language function, https://reference.wolfram.com/language/ref/ThermometerGauge.html (updated 2015).
CMS
Wolfram Language. 2012. "ThermometerGauge." Wolfram Language & System Documentation Center. Wolfram Research. Last Modified 2015. https://reference.wolfram.com/language/ref/ThermometerGauge.html.
APA
Wolfram Language. (2012). ThermometerGauge. Wolfram Language & System Documentation Center. Retrieved from https://reference.wolfram.com/language/ref/ThermometerGauge.html