


TernaryListPlot
TernaryListPlot[{{u1,v1,w1},…,{un,vn,wn}}]
plots a list of points with specified u, v and w coordinates in a barycentric coordinate system.
TernaryListPlot[{data1,data2,…}]
plots a ternary plot with several datasets datai.
Details and Options
- Ternary plots are also known as triangle plots or triaxial plots.
- Ternary plots are typically used to show relative proportions among three components in a whole, such as composition of soil in geology, elements in a mixture in chemistry or sources of calories in nutrition.
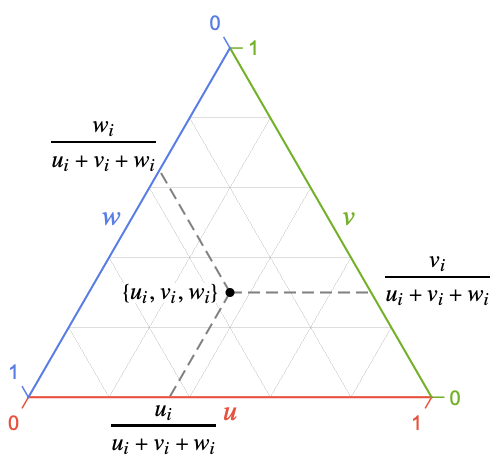
- Each point {ui,vi,wi} is normalized by using ui/ti, vi/ti and wi/ti, where ti=ui+vi+wi.
- Points with negative or nonreal coordinates will be taken as missing data.
- The transformation from the point {u,v,w} in barycentric coordinates to {x,y} in Cartesian coordinates is given by {x=v+
 w, y=
w, y= w}.
w}. - TernaryListPlot draws points inside an equilateral triangle, with the u, v and w coordinates corresponding respectively to the bottom, right and left edges.
- Coordinates ui, vi and wi can be given in the following forms:
-
ui a real-valued number Quantity[ui,unit] a quantity with a unit - Values that are not of the form shown previously are taken to be missing and are not shown.
- The datai have the following forms and interpretations:
-
<"k1"{u1,v1,w1},"k2"{u2,v2,w2},…> values {y1,y2,…} {{u1,v1,w1}"lbl1",{u1,v1,w1}"lbl2",…}, {{u1,v1,w1},{u1,v1,w1},…}{"lbl1","lbl2",…} values {y1,y2,…} with labels {lbl1,lbl2,…} SparseArray values as a normal array TimeSeries, EventSeries time-value pairs QuantityArray magnitudes NumericArray values as a normal array WeightedData unweighted values - TernaryListPlot[Tabular[…]cspec] extracts and plots values from the tabular object using the column specification cspec.
- The following forms of column specifications cspec are allowed for plotting tabular data:
-
{colu,colv,colw} plot the data from columns colu, colv and colw {{colu1,colv1,colw1},{colu2,colv2,colw2},…} plot columns colu1, colv1 and colw1 as a set, etc. - The following wrappers w can be used for the datai:
-
Annotation[datai,label] provide an annotation for the data Button[datai,action] define an action to execute when the data is clicked Callout[datai,label] label the data with a callout Callout[datai,label,pos] place the callout at relative position pos EventHandler[datai,…] define a general event handler for the data Hyperlink[datai,uri] make the data a hyperlink Labeled[datai,label] label the data Labeled[datai,label,pos] place the label at relative position pos Legended[datai,label] identify the data in a legend PopupWindow[datai,cont] attach a popup window to the data StatusArea[datai,label] display in the status area on mouseover Style[datai,styles] show the data using the specified styles Tooltip[datai,label] attach a tooltip to the data Tooltip[datai] use data values as tooltips - Wrappers w can be applied at multiple levels:
-
{…,w[{ui,vi,wi}],…} wrap the point {ui,vi,wi} w[datai] wrap the data w[{data1,…}] wrap a collection of datai w1[w2[…]] use nested wrappers - Callout, Labeled and Placed can use the following positions pos:
-
Automatic automatically placed labels 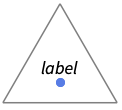
Above positions above data or points 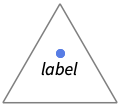
Below positions below data or points 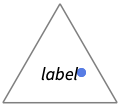
Before positions before data or points 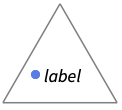
After positions after data or points 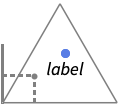
{pos,epos} epos in label placed at relative position pos of the data - TernaryListPlot has the same options as Graphics, with the following additions and changes: [List of all options]
-
AspectRatio Automatic ratio of width to height ColorFunction None how to determine the coloring of points ColorFunctionScaling True whether to scale arguments to ColorFunction Frame True whether to put a frame around the plot GridLines Automatic grid lines to draw GridLinesStyle {} how to style grid lines Joined False whether to join points LabelingFunction Automatic how to label points LabelingSize Automatic maximum size of callouts and labels PerformanceGoal $PerformanceGoal aspects of performance to try to optimize PlotInteractivity $PlotInteractivity whether to allow interactive elements PlotLabel None overall label for the plot PlotLabels None labels for data PlotLegends None legends for data PlotMarkers None markers to use to indicate each point PlotRange Automatic range of values to include PlotStyle Automatic graphics directives to determine styles of points PlotTheme $PlotTheme overall theme for the plot TargetUnits Automatic units to display in the plot TernaryPlotCorners Automatic how to position the plot corners - The setting PlotRange{rangeu,rangev,rangew} uses the given ranges for each of the three axes. The ranges will be extended to ensure a whole triangle is shown.
- Options that apply to each coordinate dimension, such as Axes, Frame and GridLines, can take the following forms:
-
s use regular setting s for each dimension {su,sv,sw} use setting su for the u direction etc. - The setting GridLinesStyleAutomatic will inherit the style used by axes or frames to draw the corresponding grid lines.
- ColorData["DefaultPlotColors"] gives the default sequence of colors used by PlotStyle.
- The arguments to ColorFunction are
 ,
,  and
and  . By default, they are scaled so that the smallest values are zero and the largest values are one.
 - Setting ColorFunctionScalingFalse uses the unscaled, normalized values for the points.
- When using data with units, the units for all components must be compatible.
- TargetUnitsunit specifies what unit to use.
List of all options
Examples
open all close allBasic Examples (4)
Generate a ternary plot for a list of points whose values add up to 1:
TernaryListPlot[{{0.15, 0.30, 0.55}, {0.25, 0.70, 0.5}, {0.40, 0.50, 0.10}, {0.80, 0.0, 0.20}, {0.55, 0.35, 0.10}, {0.30, 0.45, 0.25}, {0.15, 0.40, 0.45}, {0.80, 0.15, 0.05}, {0.45, 0.30, 0.25}, {0.25, 0.10, 65}}, FrameLabel -> {"A", "B", "C"}]TernaryListPlot[RandomReal[1, {4, 10, 3}]]TernaryListPlot[RandomReal[1, {15, 3}] -> Range[15]]Use plot markers to identify different sets:
TernaryListPlot[RandomReal[1, {4, 5, 3}], PlotMarkers -> Automatic]Scope (35)
General Data (5)
Plot sets corresponding to fixed fractions of the first element "A":
TernaryListPlot[Table[{i, r, 100 - i - r}, {i, 10, 90, 10}, {r, 0, 100 - i}], ...]TernaryListPlot[Table[{r, i, 100 - i - r}, {i, 10, 90, 10}, {r, 0, 100 - i}], ...]TernaryListPlot[Table[{r, 100 - i - r, i}, {i, 10, 90, 10}, {r, 0, 100 - i}], ...]Plot sets corresponding to fixed ratios of the element "B" to "C":
TernaryListPlot[Table[{i, r(100 - i) / (r + 1), (100 - i) / (r + 1)}, {r, {10, 4, 2, 1, 1 / 2, 1 / 4, 1 / 10}}, {i, 0, 100}], ...]TernaryListPlot[Table[{r(100 - i) / (r + 1), i, (100 - i) / (r + 1)}, {r, {10, 4, 2, 1, 1 / 2, 1 / 4, 1 / 10}}, {i, 0, 100}], ...]TernaryListPlot[Table[{r(100 - i) / (r + 1), (100 - i) / (r + 1), i}, {r, {10, 4, 2, 1, 1 / 2, 1 / 4, 1 / 10}}, {i, 0, 100}], ...]Each data point is independently normalized so the elements sum to 1:
Short[data = RandomReal[10, {10, 3}]]Total /@ dataShort[ndata = # / Total[#]& /@ data]Total /@ ndata{TernaryListPlot[data], TernaryListPlot[ndata]}Nonreal and negative data is taken to be missing:
data = ReplacePart[RandomInteger[{1, 10}, {10, 3}], {2 -> Missing[], 4 -> 1 + I, 6 -> foo, 9 -> {-2, -3, -4}}]TernaryListPlot[data]Multiple datasets are styled differently:
TernaryListPlot[RandomReal[1, {3, 10, 3}]]Tabular Data (1)
Get tabular data about grams of certain nutrients per 100 grams of different foods:
tabular = Tabular[IconizedObject[«data»], {"Type", "Name", "TotalFat", "TotalProtein", "TotalCarbs"}]Plot a TernaryListPlot with grams of fat, protein and carbohydrates per each food:
TernaryListPlot[tabular -> {"TotalFat", "TotalProtein", "TotalCarbs"}]Use PivotToColumns to create columns of fat, carbs and protein per food type:
pivot = PivotToColumns[tabular, "Type" -> "TotalFat"]Plot fats, proteins and carbs for each type of food:
TernaryListPlot[pivot -> {{"Meat", "TotalProtein", "TotalCarbs"}, {"Fruits", "TotalProtein", "TotalCarbs"}}, PlotLegends -> {"Meat", "Fruits"}]Special Data (4)
data = Table[{Quantity[RandomReal[], "Meters"], Quantity[RandomReal[], "Feet"], Quantity[RandomReal[], "Meters"]}, {10}];TernaryListPlot[data]Specify the desired target units:
TernaryListPlot[data, TargetUnits -> "Feet"]TernaryListPlot[QuantityArray[StructuredArray`StructuredData[{10, 3},
{{{0.8041756743790625, 0.47912751511486307, 0.012658141262634981},
{0.7988069403413249, 0.7710180820251655, 0.9784925350135298},
{0.6676772794392527, 0.38669537190013403, 0.83302475 ... 17796031747966},
{0.6469722578596451, 0.19952140170247112, 0.3400946028129841},
{0.041851304211702356, 0.04783624467156811, 0.8512879176225363},
{0.31292398630199436, 0.9243290880167649, 0.7170633095932528}}, "Meters", {{1}, {2}}}]]]Specify strings to use as labels:
TernaryListPlot[RandomInteger[{1, 10}, {10, 3}] -> {"a", "b", "c", "d", "e", "f", "g", "h", "i", "j"}]Specify a location for labels:
TernaryListPlot[RandomInteger[{1, 10}, {10, 3}] -> {"a", "b", "c", "d", "e", "f", "g", "h", "i", "j"}, LabelingFunction -> Above]Data Wrappers (5)
Use wrappers on individual data, datasets or collections of datasets:
{TernaryListPlot[{{{0.6, 0.1, 0.3}, Style[{0.6, 0.2, 0.2}, Red], {0.6, 0.3, 0.1}}, {{0.2, 0.7, 0.1}, {0.2, 0.2, 0.6}, Style[{0.2, 0.4, 0.3}, Green]}}, PlotStyle -> PointSize[0.05]], TernaryListPlot[{Style[{{0.6, 0.1, 0.3}, {0.6, 0.2, 0.2}, {0.6, 0.3, 0.1}}, Red], Style[{{0.2, 0.7, 0.1}, {0.2, 0.2, 0.6}, {0.2, 0.4, 0.3}}, Green]}, PlotStyle -> PointSize[0.05]], TernaryListPlot[Style[{{{0.6, 0.1, 0.3}, {0.6, 0.2, 0.2}, {0.6, 0.3, 0.1}}, {{0.2, 0.7, 0.1}, {0.2, 0.2, 0.6}, {0.2, 0.4, 0.3}}}, Blue], PlotStyle -> PointSize[0.05]]}TernaryListPlot[Style[{Style[{{0.6, 0.1, 0.3}, Style[{0.6, 0.2, 0.2}, Red], {0.6, 0.3, 0.1}}, Green], {{0.2, 0.7, 0.1}, {0.2, 0.2, 0.6}, {0.2, 0.4, 0.3}}}, Blue], PlotStyle -> PointSize[0.05]]TernaryListPlot[{{0.1, 0.8, 0.2}, Callout[{0.2, 0.3, 0.2}, "callout"], {0.5, 0.2, 0.3}, {0.2, 0.2, 0.6}}]Set a Style for each dataset:
TernaryListPlot[{Style[RandomReal[1, {10, 3}], Red], Style[RandomReal[1, {10, 3}], Directive[Opacity[0.5], PointSize[.025], Blue]]}]TernaryListPlot[{Style[{Callout[{1, 2, 3}, "one"], Callout[{1, 1, 1}, "two"]}, Purple], Style[{StatusArea[{2, .5, 2}, "three"], Tooltip[{2, 1, 1}, "four"]}, PointSize[0.025]]}]Labeling and Legending (12)
TernaryListPlot[{{0.1, 0.8, 0.2}, Labeled[{0.2, 0.3, 0.2}, "label"], {0.5, 0.2, 0.3}, {0.2, 0.2, 0.6}}]TernaryListPlot[RandomInteger[{1, 10}, {10, 3}] -> Range[10]]Label data with Labeled:
TernaryListPlot[{Labeled[Table[{20, r = RandomReal[100 - 20], 100 - 20 - r}, 10], "%20", Left], Labeled[Table[{60, r = RandomReal[100 - 60], 100 - 60 - r}, 10], "%60", Left]}]Label data with PlotLabels:
TernaryListPlot[{Table[{20, r = RandomReal[100 - 20], 100 - 20 - r}, 10], Table[{60, r = RandomReal[100 - 60], 100 - 60 - r}, 10]}, PlotLabels -> {"%20", "%60"}]Label data with Callout:
TernaryListPlot[{Callout[Table[{20, r = RandomReal[100 - 20], 100 - 20 - r}, 10], "%20"], Callout[Table[{60, r = RandomReal[100 - 60], 100 - 60 - r}, 10], "%60", Left]}]Use Placed to control label positions:
data = RandomReal[1, {5, 3, 3}];Table[TernaryListPlot[{Table[Flatten[{4, RandomReal[{0.25, 1.25}, 2]}], 10], Table[Flatten[{RandomReal[{0.25, 1.25}, 2], 4}], 10], Table[Flatten[{RandomReal[{0.25, 1.25}], 4, RandomReal[{0.25, 1.25}]}], 10]}, PlotStyle -> PointSize[0.02], PlotLabels -> Placed[Range[3], pos], PlotLabel -> pos, ImageSize -> 225], {pos, {Left, Right, Below, Above}}]Label points at automatically optimized positions:
data = {Table[Flatten[{4, RandomReal[{0.25, 1.25}, 2]}], 10], Table[Flatten[{RandomReal[{0.25, 1.25}, 2], 4}], 10], Table[Flatten[{RandomReal[{0.25, 1.25}], 4, RandomReal[{0.25, 1.25}]}], 10]};TernaryListPlot[data, PlotLabels -> {"A", "B", "C"}]Specify PlotLegends for each dataset:
TernaryListPlot[data, PlotLegends -> {"data 1", "data 2", "data 3"}]Specify the maximum size of labels:
data = Table[Labeled[RandomReal[1, 3], RandomWord[]], {i, 10}];TernaryListPlot[data, LabelingSize -> 40]TernaryListPlot[data, LabelingSize -> Full]For dense sets of points, some labels may be turned into tooltips by default:
data = Table[Callout[RandomReal[1, 3], i], {i, 100}];TernaryListPlot[data]Increasing the size of the plot will show more labels:
TernaryListPlot[data, ImageSize -> 400]Include legends for each dataset:
TernaryListPlot[{Table[{20, r = RandomReal[100 - 20], 100 - 20 - r}, 10], Table[{60, r = RandomReal[100 - 60], 100 - 60 - r}, 10]}, PlotLegends -> {"20%", "%60"}]Use Legended to provide a legend to a specific dataset:
a = RandomReal[{0.3, 1}, {50, 3}];
b = RandomReal[0.3, {50, 3}];TernaryListPlot[{a, Legended[Mean[{a, b}], "average"], b}]Use Placed to change the legend location:
TernaryListPlot[{a, Legended[Mean[{a, b}], Placed["average", Below]], b}]Use association keys as labels:
TernaryListPlot[<|"One" -> RandomReal[1, {5, 3}], "Two" -> RandomReal[1, {5, 3}], "Three" -> RandomReal[1, {5, 3}]|>, PlotStyle -> PointSize[0.02], PlotLabels -> Automatic]Presentation (8)
Multiple sets are automatically colored to be distinct:
data = RandomReal[1, {3, 10, 3}];TernaryListPlot[data]Provide explicit styling to different sets:
TernaryListPlot[data, PlotStyle -> {Purple, Brown, Yellow}]Color points with ColorFunction:
data = RandomReal[1, {200, 3}];TernaryListPlot[data, ColorFunction -> "SunsetColors"]TernaryListPlot[data, ColorFunction -> (ColorData["SunsetColors"][#1 ^ 2 + #2 ^ 2 + #3 ^ 2]&)]Color by bottom, right and left coordinates:
Table[TernaryListPlot[RandomReal[1, {2000, 3}], PlotLabel -> Hue[var], ColorFunction -> Function[{a, b, c}, Evaluate[Hue[var]]]], {var, {a, b, c}}]TernaryListPlot[RandomReal[1, {4, 5, 3}], PlotMarkers -> Automatic]TernaryListPlot[RandomReal[1, {4, 5, 3}], PlotMarkers -> {"α", "β", "θ", "δ"}]data = {{0, 0.8, 0.2}, {0.5, 0.3, 0.2}, {0.5, 0.2, 0.3}, {0, 0.2, 0.8}};{TernaryListPlot[Style[data, Joined]], TernaryListPlot[data, Joined -> True]}Style datasets or collections of datasets:
{d1, d2, d3} = RandomReal[1, {3, 3, 3}];{TernaryListPlot[{Style[d1, Purple], d2, d3}], TernaryListPlot[Style[{d1, d2, d3}, AbsolutePointSize[5]]]}TernaryListPlot[RandomReal[1, {10, 3}], GridLines -> {{{0.2, Red}, {0.5, Blue}, {0.8, Purple}}}]data = RandomReal[1, {10, 3}];TernaryListPlot[data, Frame -> False]Set FrameTicksStyle:
TernaryListPlot[data, FrameTicksStyle -> Red]TernaryListPlot[data, Axes -> True]TernaryListPlot[data, AxesStyle -> {Red, Green, Blue}, Axes -> True]Show axes and set the frame off to show the 0% lines:
TernaryListPlot[data, Frame -> False, GridLinesStyle -> {RGBColor[0.5, 0.19, 0.5], RGBColor[0.02, 0.76, 0.88], RGBColor[0.29, 0.81, 0]}, GridLines -> Automatic, Axes -> True, AxesStyle -> Red]Options (39)
Axes (1)
AxesStyle (1)
Background (1)
ColorFunction (3)
Color points by the x direction value:
data = RandomReal[1, {50, 3}];TernaryListPlot[data, ColorFunction -> "Rainbow"]TernaryListPlot[data, ColorFunction -> Function[{x, y, z}, ColorData["Rainbow"][x ^ 2 + y ^ 2 + z ^ 2]]]Color by bottom, right and left coordinates:
data = RandomReal[1, {2000, 3}];Table[TernaryListPlot[data, PlotLabel -> Hue[var], ColorFunction -> Function[{a, b, c}, Evaluate[Hue[var]]]], {var, {a, b, c}}]ColorFunction overrides PlotStyle:
data = RandomReal[1, {50, 3}];TernaryListPlot[data, PlotStyle -> Red, ColorFunction -> "Rainbow"]ColorFunctionScaling (2)
Use ColorFunctionScaling False to get an unscaled value:
TernaryListPlot[RandomReal[1, {50, 3}], ColorFunctionScaling -> False, ColorFunction -> "Rainbow"]ColorFunctionScaling by default is True:
TernaryListPlot[RandomReal[0.1, {50, 3}], ColorFunctionScaling -> False, ColorFunction -> "Rainbow"]Frame (1)
data = RandomReal[1, {10, 3}];TernaryListPlot[data]TernaryListPlot[data, Frame -> False]TernaryListPlot[data, Frame -> {True, False, True}]Show the 0% lines when the frame is off:
TernaryListPlot[data, Frame -> False, GridLinesStyle -> {RGBColor[0.5, 0.19, 0.5], RGBColor[0.02, 0.76, 0.88], RGBColor[0.29, 0.81, 0]}, GridLines -> Automatic]FrameLabel (1)
FrameStyle (1)
data = RandomReal[1, {20, 3}];TernaryListPlot[data, FrameStyle -> {Red, Green, Blue}]Automatic GridLinesStyle are inherited from FrameStyle:
TernaryListPlot[data, FrameStyle -> {Red, Green, Blue}, GridLinesStyle -> Automatic, GridLines -> Automatic]TernaryListPlot[data, FrameStyle -> AbsoluteThickness[1.5]]FrameTicks (1)
FrameTicksStyle (1)
GridLines (2)
data = RandomReal[1, {20, 3}];TernaryListPlot[data, GridLines -> True]TernaryListPlot[data, GridLines -> False]Draw grid lines at specific positions:
data = RandomReal[1, {10, 3}];TernaryListPlot[data, GridLines -> {Range[0, 1, 0.3]}]TernaryListPlot[data, GridLines -> {Range[0, 1, 0.3], Range[0, 1, 0.4], Range[0, 1, 0.5]}]TernaryListPlot[data, GridLines -> {{{0.2, Red}, {0.5, Blue}, {0.8, Green}}}]GridLines overrides GridLinesStyle:
TernaryListPlot[data, GridLines -> {{{0.2, Directive[Red, Dashing[None]]}, {0.5, Blue}, {0.8, Green}}}, GridLinesStyle -> Dashed]GridLinesStyle (1)
data = RandomReal[1, {20, 3}];TernaryListPlot[data, GridLinesStyle -> Blue, GridLines -> Automatic]Style grid lines in each direction:
TernaryListPlot[data, GridLinesStyle -> {Directive[Red, Dotted], Directive[Dashed, Green], Directive[AbsoluteThickness[3], Brown]}, GridLines -> Automatic]Joined (2)
Points are joined in order of data:
TernaryListPlot[{{0, 0.8, 0.2}, {0.5, 0.3, 0.2}, {0.5, 0.2, 0.3}, {0, 0.2, 0.8}}, Joined -> True]TernaryListPlot[{{0, 0.8, 0.2}, {0.5, 0.3, 0.2}, {0.5, 0.2, 0.3}, {0, 0.2, 0.8}}, Joined -> True, PlotMarkers -> Automatic]Method (5)
TernaryListPlot[RandomReal[1, {10, 3}], Method -> {"Highlighting" -> True}]TernaryListPlot[RandomReal[1, {10, 3}], Method -> {"Highlighting" -> True, "HighlightColor" -> Red}]Use highlighting for axes and frames:
TernaryListPlot[RandomReal[1, {10, 3}], Method -> {"Highlighting" -> True, "HighlightColor" -> Red}, Axes -> {True, False, True}]Change the background color of the area with data:
TernaryListPlot[RandomReal[1, {10, 3}], Method -> {"Backdrop" -> LightYellow}]The backdrop area is associated with PlotRange:
TernaryListPlot[RandomReal[1, {10, 3}], Method -> {"Backdrop" -> LightYellow}, PlotRange -> {{0, 0.8}, {0, 0.8}, {0, 0.8}}]PlotInteractivity (3)
Plots have interactive highlighting by default:
TernaryListPlot[{{19, 4, 77}, {38, 49, 13}, {30, 7, 63}, {23, 60, 17}, {27, 44, 29}, {12, 27, 61}, {11, 19, 70}, {25, 65, 10}, {40, 45, 15}, {36, 30, 34}}]Turn off all the interactive elements:
TernaryListPlot[{{19, 4, 77}, {38, 49, 13}, {30, 7, 63}, {23, 60, 17}, {27, 44, 29}, {12, 27, 61}, {11, 19, 70}, {25, 65, 10}, {40, 45, 15}, {36, 30, 34}}, PlotInteractivity -> False]Allow provided interactive elements and disable automatic ones:
TernaryListPlot[{{19, 4, 77}, {38, 49, 13}, {30, 7, 63}, {23, 60, 17}, {27, 44, 29}, {12, 27, 61}, {11, 19, 70}, {25, 65, 10}, {40, 45, 15}, Tooltip[{36, 30, 34}, "hello"]}, PlotInteractivity -> <|"User" -> True, "System" -> False|>]PlotLabels (3)
Label points at automatically optimized positions:
TernaryListPlot[{Table[Flatten[{4, RandomReal[{0.25, 1.25}, 2]}], 10], Table[Flatten[{RandomReal[{0.25, 1.25}, 2], 4}], 10], Table[Flatten[{RandomReal[{0.25, 1.25}], 4, RandomReal[{0.25, 1.25}]}], 10]}, PlotLabels -> {"A", "B", "C"}]Use Placed to control label positions:
data = RandomReal[1, {5, 3, 3}];Table[TernaryListPlot[{Table[Flatten[{4, RandomReal[{0.25, 1.25}, 2]}], 10], Table[Flatten[{RandomReal[{0.25, 1.25}, 2], 4}], 10], Table[Flatten[{RandomReal[{0.25, 1.25}], 4, RandomReal[{0.25, 1.25}]}], 10]}, PlotStyle -> PointSize[0.02], PlotLabels -> Placed[Range[3], pos], PlotLabel -> pos, ImageSize -> 225], {pos, {Left, Right, Below, Above}}]data = RandomReal[1, {10, 3}];
d1 = Transpose[Transpose[data] + {0.7, 0.1, 0.1}];
d2 = Transpose[Transpose[data] + {0.1, 0.1, 0.7}];TernaryListPlot[{Table[Flatten[{4, RandomReal[{0.25, 1.25}, 2]}], 10], Table[Flatten[{RandomReal[{0.25, 1.25}, 2], 4}], 10]}, {PlotLabels -> {"aardcark", "barracuda"}, PlotLabels -> {1, 2}, PlotLabels -> {1, 2}}]PlotLegends (1)
Show Automatic legends for different datasets:
data = RandomReal[1, {10, 3}];d1 = Transpose[Transpose[data] + {1, 0, 0}];
d2 = Transpose[Transpose[data] + {0, 0, 1}];
d3 = Transpose[Transpose[data] + {0, 1, 0}];TernaryListPlot[{d1, d2, d3}, PlotLegends -> Automatic]Specify legends for each dataset:
TernaryListPlot[{d1, d2, d3}, PlotLegends -> {"d1", "d2", "d3"}]Specify legends for each dataset using PlotMarkers:
TernaryListPlot[{d1, d2, d3}, PlotLegends -> {"d1", "d2", "d3"}, PlotMarkers -> Automatic]PlotMarkers (3)
Use a default sequence of shapes to distinguish datasets:
TernaryListPlot[IconizedObject[«multi-data»], PlotMarkers -> Automatic]TernaryListPlot[IconizedObject[«multi-data»], PlotMarkers -> None]Use text or typeset labels to distinguish datasets:
TernaryListPlot[IconizedObject[«multi-data»], PlotMarkers -> {"α", "β", "γ"}]TernaryListPlot[IconizedObject[«multi-data»], PlotMarkers -> {"☺", "", "☹"}]
Use any graphic to distinguish datasets:
TernaryListPlot[IconizedObject[«multi-data»], PlotMarkers -> {{[image], 0.07}, {[image], 0.07}, {[image], 0.07}}]Control font sizes for text markers:
Table[TernaryListPlot[IconizedObject[«multi-data»], PlotMarkers -> {"α", size}, PlotLabel -> size], {size, {10, 20}}]Control sizes for graphics markers relative to the plot:
Table[TernaryListPlot[IconizedObject[«multi-data»], PlotMarkers -> {[image], size}, PlotLabel -> size], {size, {0.05, 0.1}}]Control absolute sizes for graphics markers:
Table[TernaryListPlot[IconizedObject[«multi-data»], PlotMarkers -> {[image], Offset[size]}, PlotLabel -> size], {size, {7, 14}}]Use preset names to control graphics marker size:
Table[TernaryListPlot[IconizedObject[«multi-data»], PlotMarkers -> {[image], size}, PlotLabel -> size], {size, {Tiny, Small, Medium, Large}}]PlotRange (1)
PlotStyle (3)
TernaryListPlot[RandomReal[1, {2, 10, 3}], PlotStyle -> PointSize[0.03]]TernaryListPlot[IconizedObject[«multi-data»], PlotStyle -> {Red, Orange, Blue}]TernaryListPlot[IconizedObject[«multi-data»], PlotStyle -> {Red, Blue}]TargetUnits (1)
TernaryPlotCorners (1)
By default, the plot corners are positioned anticlockwise:
data = RandomReal[1, {10, 3}];TernaryListPlot[data]Position the plot corners clockwise:
TernaryListPlot[data, TernaryPlotCorners -> "Clockwise"]Place the corners at given coordinates:
TernaryListPlot[data, TernaryPlotCorners -> {{1, 0}, {0, 0}, {0, 1}}]Applications (7)
Geology (2)
TernaryListPlot[IconizedObject[«Soil Data»], FrameLabel -> {Style["Sand", Bold, 16], Style["Silt", Bold, 16], Style["Clay", Bold, 16]}]Plot a soil texture triangle with shaded regions:
TernaryListPlot[IconizedObject[«Soil Data»], FrameLabel -> {Style["Sand", Bold, 16], Style["Silt", Bold, 16], Style["Clay", Bold, 16]}, Prolog -> {{Directive[{Opacity[0.5], RGBColor[1, 0.5, 0]}], Polygon[{{0.2, 0.6, 0.2}, {0.2, 0.2, 0.6}, {0.6, 0.2, 0.2}}]}, ...}]Agriculture (2)
Plot the fraction of fertilizers used each year:
TernaryListPlot[IconizedObject[«N-P-K data»], FrameLabel -> {"Nitrogen", "Phosphate", "Potash"}]Show the planted fractions of three crops, corn, soybeans and wheat:
TernaryListPlot[IconizedObject[«Planted acres data»] , FrameLabel -> {"Corn", "Soy", "Wheat"}]Other (3)
Show the sources of electricity for countries around the world:
TernaryListPlot[MapThread[Tooltip[#1, #2]&, {EntityValue[EntityList[Entity["GeographicRegion", "World"][EntityProperty["GeographicRegion", "Countries"]]], {"ElectricityConventionalThermal", "ElectricityNuclear", "ElectricityTotalRenewables"}], EntityList[Entity["GeographicRegion", "World"][EntityProperty["GeographicRegion", "Countries"]]]}], AxesLabel -> {"Fossil fuels", "Nuclear", "Renewables"}, Axes -> True, PlotStyle -> Red]Show the fraction of child, adult and elderly populations around the world:
TernaryListPlot[EntityValue[EntityClass["Country", "Countries"], EntityFunction[e, Tooltip[{e[EntityProperty["Country", "ChildPopulation"]], e[EntityProperty["Country", "AdultPopulation"]], e[EntityProperty["Country", "ElderlyPopulation"]]}, e["Name"]]]], FrameLabel -> {"Child", "Adult", "Elderly"}, ColorFunction -> "RoseColors"]Show the fractions of fat, carbohydrates and proteins in a variety of foods:
TernaryListPlot[Tooltip[{##2}, #]&@@@IconizedObject[«foods»], FrameLabel -> {"Fat", "Carbs", "Protein"}, LabelStyle -> {Bold, 11}, PlotStyle -> PointSize[.015], GridLinesStyle -> Lighter[Gray], ColorFunction -> "Rainbow"]Text
Wolfram Research (2022), TernaryListPlot, Wolfram Language function, https://reference.wolfram.com/language/ref/TernaryListPlot.html (updated 2025).
CMS
Wolfram Language. 2022. "TernaryListPlot." Wolfram Language & System Documentation Center. Wolfram Research. Last Modified 2025. https://reference.wolfram.com/language/ref/TernaryListPlot.html.
APA
Wolfram Language. (2022). TernaryListPlot. Wolfram Language & System Documentation Center. Retrieved from https://reference.wolfram.com/language/ref/TernaryListPlot.html