


ArrayPlot3D
ArrayPlot3D[array]
generates a plot in which the values in an array are shown in a discrete array of cubes.
Details and Options
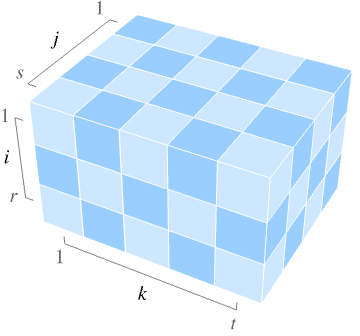
- ArrayPlot3D[array] by default arranges the array elements aijk with increasing values of i going from top to bottom, j from back to front and k from left to right.
- Possible forms of array include:
-
{{{a111,…,a11t},…,{a1s1,…,a1st}},…,{{ar11,…,ar1t},…,{ars1,…,arst}}} normal array SparseArray values as a normal array QuantityArray magnitudes NumericArray values as a normal array SymmetrizedArray values as a normal array Dataset values as a normal array - If array is ragged, shorter dimensions are treated as padded on the right with empty space.
- If array contains 0s and 1s, the 1s will appear as black cubes and the 0s as empty space.
- ArrayPlot3D has the same options as Graphics3D, with the following additions and changes: [List of all options]
-
Axes False whether to draw axes Boxed True whether to draw the bounding box ClippingStyle None how to show cells whose values are clipped ColorFunction Automatic how each cell should be colored ColorFunctionScaling True whether to scale the argument to ColorFunction ColorRules Automatic rules for determining colors from values DataRange All the range of  and
and  values to assume
 DataReversed False whether to reverse the order of rows Lighting "Neutral" whether to use lighting Mesh Automatic whether to draw a mesh MeshStyle Automatic the style to use for a mesh Method Automatic the method to use for displaying the array MissingStyle Automatic the style to use for missing values OpacityFunction Automatic how to compute the opacity at each cell OpacityFunctionScaling True whether to scale the arguments to OpacityFunction PerformanceGoal $PerformanceGoal aspects of performance to try to optimize PlotLegends None legends for datasets PlotRange All the range of values to plot PlotTheme $PlotTheme overall theme for the plot TargetUnits Automatic units to display in the plot - The rules given by ColorRules are applied to the value aijk of each cell. The rules can involve patterns.
- If none of the rules in ColorRules apply, then ColorFunction is used to determine the color.
- With the default setting ColorRules->Automatic, an explicit setting ColorFunction->f is used instead of ColorRules.
- If the color determined for a particular cell is None, the cell is treated as empty space.
- If no color is determined for a particular cell, the cell is rendered in the color given by MissingStyle, by default a dark red color.
- ColorFunction and OpacityFunction are supplied with a single argument, given by default by the value of aijk scaled to be between 0 and 1.
- With DataReversed->True, the order of rows is reversed, so that rows run from bottom to top, with the last row at the top.
- With the setting TicksAutomatic, ticks are placed at round integers, typically multiples of 5 or 10.
- With the setting TicksAll, ticks are also placed at the minimum and maximum values of i, j and k.
- In explicit Ticks specifications, the tick coordinates are taken to refer to i, j and k.
- PlotRange can take the following forms:
-
amax show aijk values between 0 and amax {amin,amax} show aijk values between amin and amax {rangei,rangej,rangek} show aijk values with i in rangei, … {rangei,rangej,rangek,rangea} show aijk values with i in rangei, … and aijk in rangea - The array index ranges rangei, rangej and rangek can take the following forms:
-
{min,max} include indices between min and max All include all indices - Typical settings for PlotLegends include:
-
None no legend Automatic automatically determine legend Placed[lspec,…] specify placement for legend - Possible settings for Mesh include:
-
Automatic automatically show the mesh None do not show the mesh Full show mesh adjacent to filled array cells All show mesh adjacent to all array cells {speci,specj,speck} show the mesh in particular dimensions - The possible settings for Method include "Graphics3D", "Raster3D" and "ArrayMesh".
-
AlignmentPoint Center the default point in the graphic to align with AspectRatio Automatic ratio of height to width Axes False whether to draw axes AxesEdge Automatic on which edges to put axes AxesLabel None axes labels AxesOrigin Automatic where axes should cross AxesStyle {} graphics directives to specify the style for axes Background None background color for the plot BaselinePosition Automatic how to align with a surrounding text baseline BaseStyle {} base style specifications for the graphic Boxed True whether to draw the bounding box BoxRatios Automatic bounding 3D box ratios BoxStyle {} style specifications for the box ClippingStyle None how to show cells whose values are clipped ClipPlanes None clipping planes ClipPlanesStyle Automatic style specifications for clipping planes ColorFunction Automatic how each cell should be colored ColorFunctionScaling True whether to scale the argument to ColorFunction ColorRules Automatic rules for determining colors from values ContentSelectable Automatic whether to allow contents to be selected ControllerLinking False when to link to external rotation controllers ControllerPath Automatic what external controllers to try to use DataRange All the range of  and
and  values to assume
 DataReversed False whether to reverse the order of rows Epilog {} 2D graphics primitives to be rendered after the main plot FaceGrids None grid lines to draw on the bounding box FaceGridsStyle {} style specifications for face grids FormatType TraditionalForm default format type for text ImageMargins 0. the margins to leave around the graphic ImagePadding All what extra padding to allow for labels, etc. ImageSize Automatic absolute size at which to render the graphic LabelStyle {} style specifications for labels Lighting "Neutral" whether to use lighting Mesh Automatic whether to draw a mesh MeshStyle Automatic the style to use for a mesh Method Automatic the method to use for displaying the array MissingStyle Automatic the style to use for missing values OpacityFunction Automatic how to compute the opacity at each cell OpacityFunctionScaling True whether to scale the arguments to OpacityFunction PerformanceGoal $PerformanceGoal aspects of performance to try to optimize PlotLabel None a label for the plot PlotLegends None legends for datasets PlotRange All the range of values to plot PlotRangePadding Automatic how much to pad the range of values PlotRegion Automatic final display region to be filled PlotTheme $PlotTheme overall theme for the plot PreserveImageOptions Automatic whether to preserve image options when displaying new versions of the same graphic Prolog {} 2D graphics primitives to be rendered before the main plot RotationAction "Fit" how to render after interactive rotation SphericalRegion Automatic whether to make the circumscribing sphere fit in the final display area TargetUnits Automatic units to display in the plot Ticks Automatic specification for ticks TicksStyle {} style specification for ticks TouchscreenAutoZoom False whether to zoom to fullscreen when activated on a touchscreen ViewAngle Automatic angle of the field of view ViewCenter Automatic point to display at the center ViewMatrix Automatic explicit transformation matrix ViewPoint {1.3,-2.4,2.} viewing position ViewProjection Automatic projection method for rendering objects distant from the viewer ViewRange All range of viewing distances to include ViewVector Automatic position and direction of a simulated camera ViewVertical {0,0,1} direction to make vertical
List of all options
Examples
open all close allBasic Examples (4)
d = RandomInteger[1, {5, 5, 5}];ArrayPlot3D[d]Display the state of a 3D cellular automaton:
ArrayPlot3D[CellularAutomaton[
<|"GrowthCases" -> {1}, "Dimension" -> 3, "Neighborhood" -> 7|>, {{{{1}}}, 0}, {{{5}}}]]ArrayPlot3D[RandomInteger[2, {5, 5, 5}], ColorRules -> {1 -> Yellow, 2 -> Orange}]Use a standard blend as a color function:
d = RandomReal[5, {5, 5, 5}];ArrayPlot3D[d, ColorFunction -> "Rainbow"]Scope (6)
By default, 0 is not plotted and 1 is plotted in black:
ArrayPlot3D[RandomInteger[1, {5, 5, 5}]]With no opacity, 0 is plotted in white:
ArrayPlot3D[RandomInteger[1, {5, 5, 5}], OpacityFunction -> None]ArrayPlot3D[QuantityArray[RandomInteger[1, {5, 5, 5}], "Meters"], AxesLabel -> Automatic, Axes -> True]Plot a ragged array, padding on the right:
ArrayPlot3D[{{{1}, {1, 1}, {1, 0, 1}, {1, 1, 1, 1}},
	{{1}, {1, 1}, {1, 0, 1}, {1, 1, 1, 1}},
	{{1}, {1, 1}, {1, 0, 1}, {1, 1, 1, 1}},
	{{1}, {1, 1}, {1, 0, 1}, {1, 1, 1, 1}}}]
Cells with value None are rendered like the background:
ArrayPlot3D[Table[If[x == y, None, 1 / (x - y)], {x, -2, 2}, {y, -2, 2}, {z, -2, 2}]]ArrayPlot3D[SparseArray[{{x_, x_, x_} -> 1, ({x_, y_, z_} /; Abs[x - y + z] < 3) -> .5}, {10, 10, 10}]]Options (32)
AspectRatio (2)
ArrayPlot3D[CellularAutomaton[{14, {2, 1}, {1, 1}}, {{{1}}, 0}, 10], AspectRatio -> 1]ArrayPlot3D[CellularAutomaton[{14, {2, 1}, {1, 1}}, {{{1}}, 0}, 10], AspectRatio -> 1 / 2]By default, ArrayPlot3D does not show any axes:
ArrayPlot3D[IconizedObject[«data»]]AxesLabel (3)
No axis labels are drawn by default:
ArrayPlot3D[IconizedObject[«data»], Axes -> True]ArrayPlot3D[IconizedObject[«data»], Axes -> True, AxesLabel -> "z"]ArrayPlot3D[IconizedObject[«data»], Axes -> True, AxesLabel -> {"k", "j", "i"}]AxesStyle (4)
Change the style for the axes:
ArrayPlot3D[IconizedObject[«data»], Axes -> True, AxesStyle -> Red]Specify the style of each axis:
ArrayPlot3D[IconizedObject[«data»], Axes -> True, AxesStyle -> {Directive[{Thick, RGBColor[0.6, 0.4, 0.2]}],
   Directive[{Thick, RGBColor[0, 0, 1]}],
   Directive[{Thick, RGBColor[0, 1, 0]}]}]
Use different styles for the ticks and the axes:
ArrayPlot3D[IconizedObject[«data»], Axes -> True, AxesStyle -> Red, TicksStyle -> Green]Use different styles for the labels and the axes:
ArrayPlot3D[IconizedObject[«data»], Axes -> True, AxesStyle -> Red, LabelStyle -> Green]ClippingStyle (1)
The default is to not show values outside the plot range:
d = RandomReal[5, {5, 5, 5}];ArrayPlot3D[d, PlotRange -> {1, 4}]Show values outside the plot range in red:
ArrayPlot3D[d, PlotRange -> {1, 4}, ClippingStyle -> Red]Show low values in gray and high values in green:
ArrayPlot3D[d, PlotRange -> {1, 4}, ClippingStyle -> {Gray, Green}]ColorFunction (2)
Map values from 0 to 1 onto colors according to Hue:
d = RandomReal[5, {5, 5, 5}];ArrayPlot3D[d, ColorFunction -> Hue]Use a pure function as the color function:
ArrayPlot3D[d, ColorFunction -> (Hue[# ^ 4 / 2]&)]Use a named color gradient from ColorData:
ArrayPlot3D[d, ColorFunction -> "Pastel"]Show elements with value 1 as black and all others as white:
ArrayPlot3D[RandomInteger[1, {5, 5, 5}], ColorFunction -> (If[# == 1, Black, White]&), ColorFunctionScaling -> False, OpacityFunction -> None]ColorFunctionScaling (1)
With ColorFunctionScaling->True, the values are first scaled to lie between 0 and 1:
d = RandomInteger[5, {5, 5, 5}];ArrayPlot3D[d, ColorFunction -> Hue, ColorFunctionScaling -> True]ColorRules (1)
Specify color rules for explicit values or patterns:
d = RandomInteger[{-5, 5}, {5, 5, 5}];ArrayPlot3D[d, ColorRules -> {1 -> Red, 2 -> Blue, 3 -> Yellow, _ -> Gray}]ColorFunction is used if no color rules apply:
ArrayPlot3D[d, ColorRules -> {1 -> Red}]Implement a "default color" by adding a rule for _:
ArrayPlot3D[d, ColorRules -> {1 -> Blue, 0 -> Green, _ -> Gray}, OpacityFunction -> None]Use any patterns in ColorRules:
ArrayPlot3D[d, ColorRules -> {_ ? EvenQ -> Red, 1 | -1 -> Blue, x_ /; x < -1 -> Gray}]Rules are used in the order given:
ArrayPlot3D[d, ColorRules -> {1 -> Red, 0 -> Blue, 1 -> Gray}]DataRange (1)
By default, array values are assumed to have integer i, j and k values:
d = RandomInteger[5, {5, 5, 5}];ArrayPlot3D[d, Axes -> True]Specify the i, j, k coordinate range for tabular data:
ArrayPlot3D[d, DataRange -> {{0, 10}, {0, 10}, {0, 10}}, Axes -> True]DataReversed (1)
Mesh (1)
MeshStyle (1)
OpacityFunction (4)
OpacityFunction is Automatic by default:
data = Table[Sin[π x]Sin[π (y + z)], {z, -2, 2, .25}, {y, -2, 2, .25}, {x, -2, 2, .25}];ArrayPlot3D[data]Use None to make the whole array opaque:
data = Table[Sin[π x]Sin[π (y + z)], {z, -2, 2, .25}, {y, -2, 2, .25}, {x, -2, 2, .25}];ArrayPlot3D[data, OpacityFunction -> None]Use a custom opacity function to specify the opacity for each value:
data = Table[Sin[π x]Sin[π (y + z)], {z, -2, 2, 0.25}, {y, -2, 2, 0.25}, {x, -2, 2, 0.25}];ArrayPlot3D[data, OpacityFunction -> (If[# < 0.4, 1, 0.25]&), Mesh -> None]Use a constant opacity Opacity[0.5]:
data = Table[Sin[π x]Sin[π y] Sin[π z], {z, -2, 2, .5}, {y, -2, 2, .5}, {x, -2, 2, .5}];ArrayPlot3D[data, OpacityFunction -> 0.5, PlotLegends -> Automatic]OpacityFunctionScaling (2)
By default, scaled values are used:
data = Table[x y z, {z, -5, 5}, {y, -5, 5}, {x, -5, 5}];ArrayPlot3D[data, OpacityFunction -> Function[f, If[f > 0, 1, 0]]]Use unscaled values by setting OpacityFunctionScaling to False:
data = Table[x y z, {z, -5, 5}, {y, -5, 5}, {x, -5, 5}];ArrayPlot3D[data, OpacityFunction -> Function[f, If[f > 0, 1, 0.25]], OpacityFunctionScaling -> False]PlotLegends (2)
d = RandomInteger[2, {3, 3, 3}];ArrayPlot3D[d]Generate a legend automatically:
ArrayPlot3D[d, PlotLegends -> Automatic]PlotLegends automatically picks up ColorFunction:
Table[ArrayPlot3D[RandomInteger[2, {10, 20, 10}], ColorFunction -> cf, PlotLegends -> Placed[Automatic, Below], ImageSize -> 100, OpacityFunction -> None], {cf, {"Pastel", GrayLevel}}]PlotRange (2)
d = RandomInteger[5, {5, 5, 5}];ArrayPlot3D[d]Plot only elements with values up to 3, leaving the rest empty:
ArrayPlot3D[d, PlotRange -> {0, 3}]The first three entries in PlotRange specify the range of i, j and k values to include:
ArrayPlot3D[d, PlotRange -> {{2, 5}, {1, 3}, {3, 5}}]ArrayPlot3D[RandomInteger[{-10, 10}, {10, 20, 10}], PlotRange -> {All, All, All, {0, All}}]PlotTheme (1)
Ticks (2)
d = RandomInteger[5, {5, 5, 5}];ArrayPlot3D[d, Axes -> True, Ticks -> Automatic]d = RandomInteger[5, {20, 20, 20}];ArrayPlot3D[d, Ticks -> {{1, 5, 10, 15}, {6, 12, 18}, {3, 7, 9, 13}}, Axes -> True]Applications (6)
Cellular Automata (2)
Plot the state of a 3D cellular automaton:
ArrayPlot3D[CellularAutomaton[{14, {2, 1}, {1, 1, 1}}, {{{{1}}}, 0}, {{{10}}}]]Plot the evolution of a 2D three-color cellular automaton:
ArrayPlot3D[CellularAutomaton[{1635, {3, 1}, {1, 1}}, {{{1}}, 0}, 25], Mesh -> None]Array Structures (4)
Highlight a specific element in an array:
array = ConstantArray[1, {3, 4, 5}];array[[1, 4, 5]] = 2;ArrayPlot3D[array]array = ConstantArray[1, {3, 4, 5}];array[[All, 4, 5]] = 2;ArrayPlot3D[array]Highlight a slice of an array:
array = ConstantArray[1, {3, 4, 5}];array[[All, All, 4]] = 2;ArrayPlot3D[array]Highlight a sub-block of values:
array = ConstantArray[1, {3, 4, 5}];array[[1 ;; 2, 2 ;; 4, 3 ;; 5]] = 2;ArrayPlot3D[array]Properties & Relations (6)
Use ArrayPlot or MatrixPlot for 2D arrays:
{ArrayPlot[{{0, 0, 1, 0}, {0, 1, 1, 0}, {1, 0, 0, 1}}], MatrixPlot[{{0, 0, 1, 0}, {0, 1, 1, 0}, {1, 0, 0, 1}}]}ArrayPlot3D uses 3D arrays, even if one of the dimensions is 1:
ArrayPlot3D[{{{0, 0, 1, 0}, {0, 1, 1, 0}, {1, 0, 0, 1}}}]Raster3D arranges elements in the opposite orders from ArrayPlot3D:
{ArrayPlot3D[{{{0, 1}, {2, 3}}, {{4, 5}, {6, 7}}}, ColorFunction -> "Rainbow", OpacityFunction -> None], Graphics3D[Raster3D[{{{0, 1}, {2, 3}}, {{4, 5}, {6, 7}}} / 7, ColorFunction -> "Rainbow"]]}The DataReversed option allows ArrayPlot3D to use the same order as Raster3D:
ArrayPlot3D[{{{0, 1}, {2, 3}}, {{4, 5}, {6, 7}}}, ColorFunction -> "Rainbow", OpacityFunction -> None, DataReversed -> {True, True, False}]Use ListDensityPlot3D for continuous densities, using varying opacity to see interior features:
data = Table[x + Sin[3z + y ^ 2], {z, -3, 3, 0.25}, {y, -3, 3, 0.25}, {x, -3, 3, 0.25}];{ListDensityPlot3D[data, ColorFunction -> "SunsetColors"], ArrayPlot3D[data, ColorFunction -> "SunsetColors"]}Image3D uses interpolated volumetric rendering to display the data:
ca = CellularAutomaton[
<|"GrowthCases" -> {1}, "Dimension" -> 3, "Neighborhood" -> 7|>, {{{{1}}}, 0}, {{{5}}}];{Image3D[ca], ArrayPlot3D[ca]}ReliefPlot creates artificial shadows for 2D data:
ReliefPlot[Import["http://exampledata.wolfram.com/hailey.dem.gz", "Data"], ColorFunction -> "GreenBrownTerrain", MaxPlotPoints -> 100]Use ComplexArrayPlot for 2D arrays of complex-valued data:
ComplexArrayPlot[RandomComplex[{-1 - I, 1 + I}, {25, 50}]]Neat Examples (3)
Plot the Sin function at integer points:
ArrayPlot3D[Table[Sin[x y z], {x, -5, 5}, {y, -5, 5}, {z, -5, 5}]]Evolution of a totalistic 3D cellular automaton:
Manipulate[ArrayPlot3D[CellularAutomaton[{rn, {2, 1}, {1, 1, 1}}, {{{Table[1, init]}}, 0}, {{{t}}}]], {{rn, 14, "rule number"}, 2, 200, 4, Appearance -> "Labeled"},
	{{t, 5, "steps"}, 0, 15, 1, Appearance -> "Labeled"},
	{{init, 1, "initial width"}, 1, 10, 1, Appearance -> "Labeled"}, Delimiter,
	{{pr, False, ""}, {True -> "fixed view", False -> "zoom to fit"}},
	AutorunSequencing -> {{1, 20}, {2, 15}, {3, 10}, {4, 5}}]
Interactively map GCD values onto colors using Hue:
Manipulate[ArrayPlot3D[Array[GCD, {10, 10, 10}], ColorFunction -> (Hue[Mod[# + a, 1]]&), ColorFunctionScaling -> True], {a, 0, 1}]Text
Wolfram Research (2020), ArrayPlot3D, Wolfram Language function, https://reference.wolfram.com/language/ref/ArrayPlot3D.html.
CMS
Wolfram Language. 2020. "ArrayPlot3D." Wolfram Language & System Documentation Center. Wolfram Research. https://reference.wolfram.com/language/ref/ArrayPlot3D.html.
APA
Wolfram Language. (2020). ArrayPlot3D. Wolfram Language & System Documentation Center. Retrieved from https://reference.wolfram.com/language/ref/ArrayPlot3D.html