


PointFigureChart
PointFigureChart[{{date1,p1},{date2,p2},…}]
makes a point and figure chart with prices pi at date datei.
PointFigureChart[{"name",daterange}]
makes a point and figure chart of closing prices for the financial entity "name" over the date range daterange.
PointFigureChart[{…},s,n]
makes a point and figure chart with point and figure height s and n reversals.
Details and Options
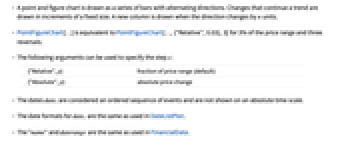
- A point and figure chart is drawn as a series of bars with alternating directions. Changes that continue a trend are drawn in increments of a fixed size. A new column is drawn when the direction changes by n units.
- PointFigureChart[…] is equivalent to PointFigureChart[…,{"Relative",0.03},3] for 3% of the price range and three reversals.
- The following arguments can be used to specify the step s:
-
{"Relative",p} fraction of price range (default) {"Absolute",p} absolute price change - The dates datei are considered an ordered sequence of events and are not shown on an absolute time scale.
- The date formats for datei are the same as used in DateListPlot.
- The "name" and daterange are the same as used in FinancialData.
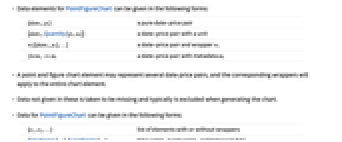
- Data elements for PointFigureChart can be given in the following forms:
-
{datei,pi} a pure date-price pair {datei,Quantity[pi,ui]} a date-price pair with a unit wi[{datei,pi},…] a date-price pair and wrapper wi formi->mi a date-price pair with metadata mi - A point and figure chart element may represent several date-price pairs, and the corresponding wrappers will apply to the entire chart element.
- Data not given in these is taken to be missing and typically is excluded when generating the chart.
- Data for PointFigureChart can be given in the following forms:
-
{e1,e2,…} list of elements with or without wrappers TimeSeries[…],EventSeries[…],TemporalData[…] time series, event series, and temporal data w[{e1,e2,…}] wrapper applied to the whole data - PointFigureChart[Tabular[…]cspec] extracts and plots values from the tabular object using the column specification cspec.
- The following forms of column specifications cspec are allowed for plotting tabular data:
-
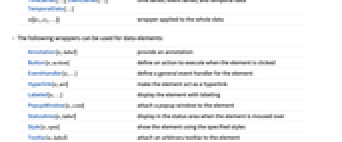
{coldate,colp} plot values from column colp against dates from coldate - The following wrappers can be used for data elements:
-
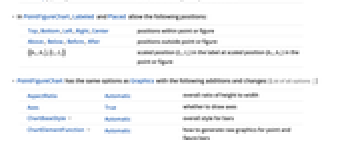
Annotation[e,label] provide an annotation Button[e,action] define an action to execute when the element is clicked EventHandler[e,…] define a general event handler for the element Hyperlink[e,uri] make the element act as a hyperlink Labeled[e,…] display the element with labeling PopupWindow[e,cont] attach a popup window to the element StatusArea[e,label] display in the status area when the element is moused over Style[e,opts] show the element using the specified styles Tooltip[e,label] attach an arbitrary tooltip to the element - In PointFigureChart, Labeled and Placed allow the following positions:
-
Top,Bottom,Left,Right,Center positions within point or figure Above, Below, Before, After positions outside point or figure {{bx,by},{lx,ly}} scaled position {lx,ly} in the label at scaled position {bx,by} in the point or figure - PointFigureChart has the same options as Graphics with the following additions and changes: [List of all options]
-
AspectRatio Automatic overall ratio of height to width Axes True whether to draw axes ChartBaseStyle Automatic overall style for bars ChartElementFunction Automatic how to generate raw graphics for point and figure bars ChartElements Automatic graphics to use in each of the points and figures DateFunction Automatic how to convert dates to standard form EventLabels None events to label GridLines Automatic grid lines to draw GridLinesStyle Automatic style for grid lines PerformanceGoal $PerformanceGoal aspects of performance to try to optimize PlotTheme $PlotTheme overall theme for the chart TrendStyle Automatic how to style up and down trends ScalingFunctions None how to scale the  axis
axisTargetUnits Automatic units to display in the chart - The arguments supplied to ChartElementFunction are the bar region {{xmin,xmax},{ymin,ymax}}, the date-price pairs list, and metadata {m1,m2,…}.
- A list of built-in settings for ChartElementFunction can be obtained from ChartElementData["PointFigureChart"].
- With the setting ChartElements->{up,down}, up and down will be used for figures and points, respectively.
- EventLabels->{…,datei->lbli,…} specifies a label associated with datei. The label will be displayed with the point or figure that has a date range that includes datei.
- With ScalingFunctions->sy, the function sy is applied to the prices. ScalingFunctions only affects the display and none of the controls.
- Style and other specifications from options and other constructs in PointFigureChart are effectively applied in the order TrendStyle, Style and other wrappers, and ChartElementFunction, with later specifications overriding earlier ones.
-
 Highlight options with settings specific to PointFigureChart
-
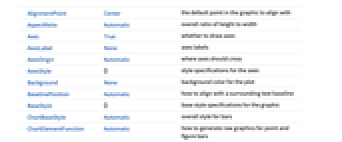
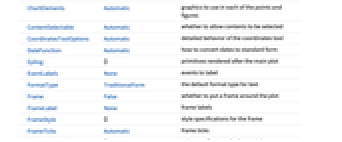
AlignmentPoint Center the default point in the graphic to align with AspectRatio Automatic overall ratio of height to width Axes True whether to draw axes AxesLabel None axes labels AxesOrigin Automatic where axes should cross AxesStyle {} style specifications for the axes Background None background color for the plot BaselinePosition Automatic how to align with a surrounding text baseline BaseStyle {} base style specifications for the graphic ChartBaseStyle Automatic overall style for bars ChartElementFunction Automatic how to generate raw graphics for point and figure bars ChartElements Automatic graphics to use in each of the points and figures ContentSelectable Automatic whether to allow contents to be selected CoordinatesToolOptions Automatic detailed behavior of the coordinates tool DateFunction Automatic how to convert dates to standard form Epilog {} primitives rendered after the main plot EventLabels None events to label FormatType TraditionalForm the default format type for text Frame False whether to put a frame around the plot FrameLabel None frame labels FrameStyle {} style specifications for the frame FrameTicks Automatic frame ticks FrameTicksStyle {} style specifications for frame ticks GridLines Automatic grid lines to draw GridLinesStyle Automatic style for grid lines ImageMargins 0. the margins to leave around the graphic ImagePadding All what extra padding to allow for labels etc. ImageSize Automatic the absolute size at which to render the graphic LabelStyle {} style specifications for labels Method Automatic details of graphics methods to use PerformanceGoal $PerformanceGoal aspects of performance to try to optimize PlotLabel None an overall label for the plot PlotRange All range of values to include PlotRangeClipping False whether to clip at the plot range PlotRangePadding Automatic how much to pad the range of values PlotRegion Automatic the final display region to be filled PlotTheme $PlotTheme overall theme for the chart PreserveImageOptions Automatic whether to preserve image options when displaying new versions of the same graphic Prolog {} primitives rendered before the main plot RotateLabel True whether to rotate y labels on the frame ScalingFunctions None how to scale the  axis
axisTargetUnits Automatic units to display in the chart Ticks Automatic axes ticks TicksStyle {} style specifications for axes ticks TrendStyle Automatic how to style up and down trends
List of all options
Examples
open all close allBasic Examples (4)
Chart the prices from a list of values:
Use three months of prices from FinancialData entities:
Scope (28)
Data and Wrappers (16)
Automatically get quarterly data for a financial entity:
Get data for a specific date range:
Get data from FinancialData:
Point and figure height by default is a fraction of the price range:
Specify increment size as a fraction of the price range:
A new column starts when price change exceeds the reversal value:
Data can be TimeSeries, EventSeries, or TemporalData:
Use wrappers on individual data:
Use wrappers on entire datasets:
Override the default tooltips:
Use PopupWindow to provide additional drilldown information:
Button can be used to trigger any action:
Tabular Data (1)
Styling and Appearance (8)
Specify styles for up and down trends:
Use classical point and figure elements:
ChartBaseStyle can be used to set a style for all chart elements:
Style can be used to override styles:
Use built-in programmatically generated bars:
Use a theme with simple ticks and grid lines in a bright color scheme:
Use a theme with a dark background in a high-contrast color scheme:
Options (61)
AspectRatio (4)
By default, PointFigureChart uses a fixed height-to-width ratio for the plot:
Make the height the same as the width with AspectRatio1:
AspectRatioAutomatic determines the ratio from the plot ranges:
AspectRatioFull adjusts the height and width to tightly fit inside other constructs:
Axes (3)
AxesOrigin (3)
AxesStyle (3)
ChartBaseStyle (4)
Use ChartBaseStyle to style the points and figures:
ChartBaseStyle combines with TrendStyle:
ChartStyle may override settings for ChartBaseStyle:
Style may override settings for ChartBaseStyle:
ChartElementFunction (4)
Get a list of built-in settings for ChartElementFunction:
ChartElementFunction shows the global scale:
Write a custom ChartElementFunction:
ChartElements (7)
Use any Graphics object for the points and figures:
Use different markers for up and down trends:
Chart elements are sized to match the point and figure heights:
Graphical elements pick up the style from TrendStyle:
EventLabels (3)
GridLines (4)
GridLinesStyle (3)
By default, GridLinesStyle uses dotted grid lines with emphasized year grid lines:
GridLines overrides GridLinesStyle:
ImageSize (7)
Use named sizes such as Tiny, Small, Medium and Large:
Specify the width of the plot:
Specify the height of the plot:
Allow the width and height to be up to a certain size:
Specify the width and height for a graphic, padding with space if necessary:
Setting AspectRatioFull will fill the available space:
Use maximum sizes for the width and height:
Use ImageSizeFull to fill the available space in an object:
Specify the image size as a fraction of the available space:
PerformanceGoal (3)
Generate a PointFigureChart with interactive highlighting:
Emphasize performance by disabling interactive behaviors:
Typically, less memory is required for non-interactive charts:
PlotRange (3)
PointFigureChart automatically draws all price dates:
Limit to a specific date range:
PlotRange only includes dates for which there is data:
PlotTheme (2)
ScalingFunction (2)
TrendStyle (6)
TrendStyle uses green for up trends and red for down trends by default:
Use black for up trends and red for down trends:
TrendStyle combines with ChartBaseStyle:
With TrendStyle set to None, the base style is used for up trends and empty bars for down trends:
TrendStyle->style uses style for up trends and empty bars for down trends:
Properties & Relations (8)
Larger height value filters out more noises:
A new column starts when price change exceeds the reversal value:
PointFigureChart only shows time periods with significant change in price:
Use CandlestickChart to visualize the financial data:
Use TradingChart to visualize and analyze financial data:
Use InteractiveTradingChart to visualize and interactively analyze financial data:
Use RenkoChart, LineBreakChart, and KagiChart to analyze the relation of financial prices and time:
Use DateListPlot to visualize financial data:
Text
Wolfram Research (2010), PointFigureChart, Wolfram Language function, https://reference.wolfram.com/language/ref/PointFigureChart.html (updated 2025).
CMS
Wolfram Language. 2010. "PointFigureChart." Wolfram Language & System Documentation Center. Wolfram Research. Last Modified 2025. https://reference.wolfram.com/language/ref/PointFigureChart.html.
APA
Wolfram Language. (2010). PointFigureChart. Wolfram Language & System Documentation Center. Retrieved from https://reference.wolfram.com/language/ref/PointFigureChart.html