How to | Get Coordinates for Points in a Plot
The Wolfram System's interactive graphics capabilities let you determine the coordinates of a single point. You can also get arbitrary sequences of points and paths, and analyze and manipulate the coordinate lists like any other data in the Wolfram System.
Selected examples from the video:
With the Get Coordinates tool you can query, copy, and paste coordinates from any graphic or plot.
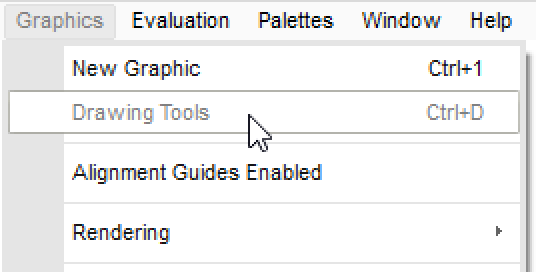
First, open the Drawing Tools palette from the Graphics menu:
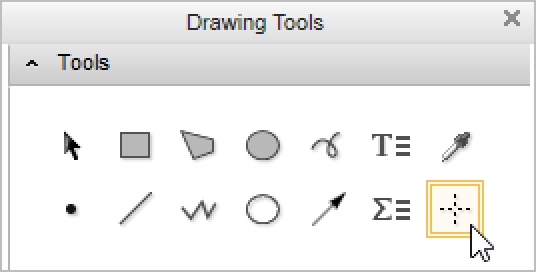
In the Drawing Tools palette, choose the Get Coordinates tool:
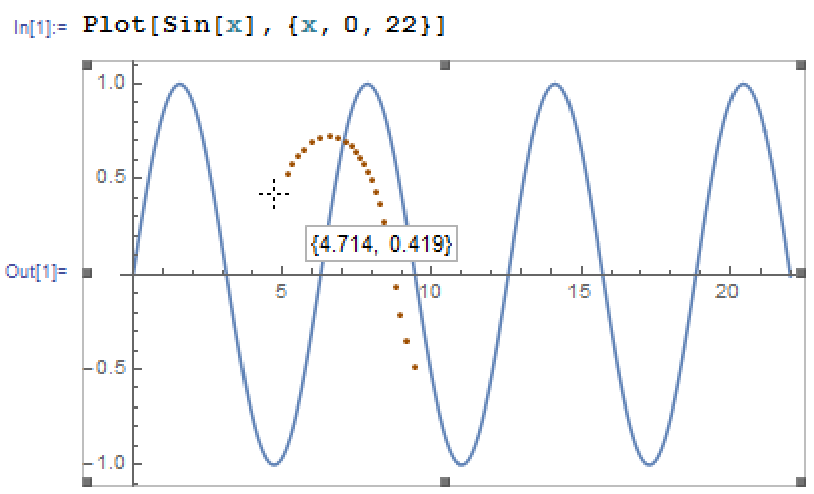
When you hover over a graphic, the coordinates of the point under the cursor are displayed next to the cursor. Clicking a point marks the point in the graphic for later copying. Similarly, dragging marks a set of points along the path:
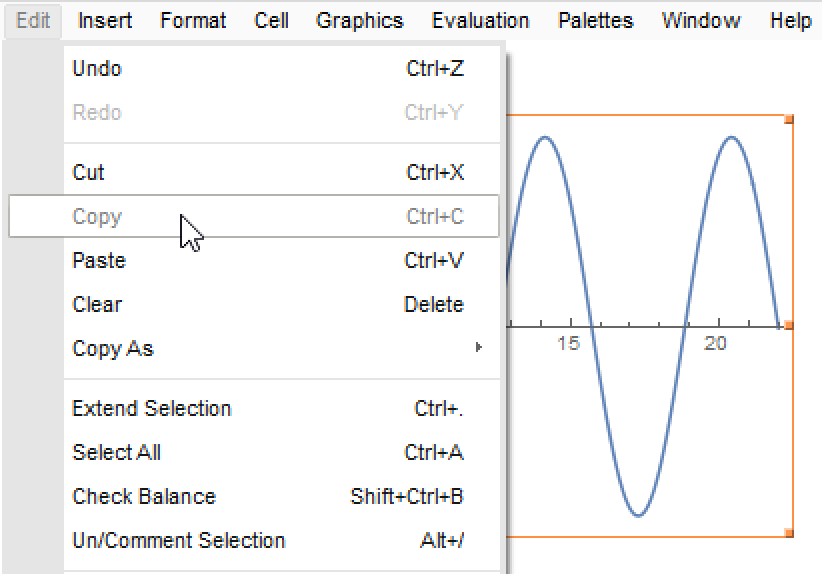
After clicking or dragging points, use Edit ▶ Copy to put the coordinates of the points on the clipboard:
Here, Edit ▶ Paste was used to paste in the selected coordinates:
{{4.034, 0.216}, {4.322, 0.4491}, {4.898, 0.5974}, {5.474, 0.6186}, {5.762, 0.6186}, {6.05, 0.6186}, {6.483, 0.6186}, {6.771, 0.6186}, {6.915, 0.5762}, {7.203, 0.5762}, {7.491, 0.555}, {7.779, 0.5338}, {8.211, 0.5126}, {8.499, 0.4703}, {8.787, 0.4703}, {9.076, 0.4491}, {9.364, 0.4491}, {9.508, 0.4067}, {9.796, 0.4067}, {10.08, 0.3643}, {10.37, 0.3219}, {10.66, 0.2795}, {10.8, 0.2372}, {10.95, 0.1948}, {11.24, 0.1736}}To mark a rectangular area on a plot, do ![]() on Windows or
on Windows or ![]() on Macintosh. You can resize a marked area using the resize handles. Clicking and dragging on a side of a rectangle will move it without resizing.
on Macintosh. You can resize a marked area using the resize handles. Clicking and dragging on a side of a rectangle will move it without resizing.
You can see here that two rectangular areas were drawn, and the resize handle appeared when the cursor was positioned over a corner:
[image]Here, the coordinate values of the rectangles were copied and pasted in as before:
{{{4.754, 0.1736}, {7.635, 0.4703}}, {{10.08, 0.08884}, {14.69, 0.5338}}}In the pasted data, each rectangle is represented by a list of the minimum and maximum coordinate values of the rectangle.