

BinnedVariogramList
BinnedVariogramList[{loc1val1,loc2val2,…}]
computes a variogram using binned values.
BinnedVariogramList[{loc1,loc2,…}{val1,val2,…}]
generates the same result.
BinnedVariogramList[…,spec]
allows binning spec to be specified as given in HistogramList.
Details and Options
- BinnedVariogramList is also known as empirical variogram or sample variogram.
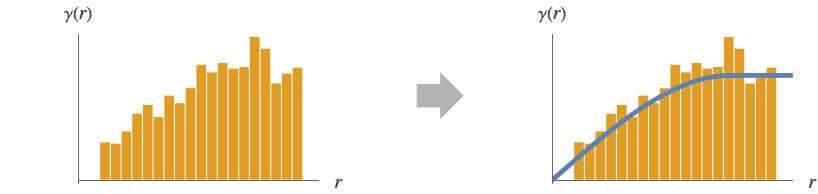
- BinnedVariogramList is typically used to get an initial assessment of the spatial data dependence in data. It is also used as a first stage in estimating high-quality EstimatedVariogramModel.
- The variogram
 for a spatial process
  at locations
  and
and  is given by
  . It is a measure of how quickly the process varies spatially.
 - When a process is weakly stationary, then the variogram depends only the difference of locations, i.e.
 . And when the process is isotropic, it only depends on the distance between locations
  where
where ![h=TemplateBox[{{{p, _, 1}, -, {p, _, 2}}}, Norm]](Files/BinnedVariogramList.en/8.png "h=TemplateBox[{{{p, _, 1}, -, {p, _, 2}}}, Norm]") .
. - The value of
 for
for  is computed as
 ![1/(2 TemplateBox[{S}, Abs])sum_({p,q} in S)(x(p)-x(q))^2](Files/BinnedVariogramList.en/11.png "1/(2 TemplateBox[{S}, Abs])sum_({p,q} in S)(x(p)-x(q))^2") , where
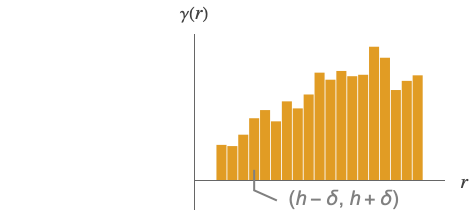
, where ![S={{p,q}|h-delta<=TemplateBox[{{p, -, q}}, Norm]<h+delta}](Files/BinnedVariogramList.en/12.png "S={{p,q}|h-delta<=TemplateBox[{{p, -, q}}, Norm]<h+delta}") . The result is a binned variogram:
. The result is a binned variogram: - The resulting binned variogram is typically not a valid variogram. It needs to be conditionally negative definite
![sum_(i=1)^nsum_(j=1)^nw_i w_j gamma(TemplateBox[{{{p, _, i}, -, {p, _, j}}}, Norm])<=0](Files/BinnedVariogramList.en/14.png "sum_(i=1)^nsum_(j=1)^nw_i w_j gamma(TemplateBox[{{{p, _, i}, -, {p, _, j}}}, Norm])<=0") for all weights wi such that
for all weights wi such that  and locations pi. However, it can be used to fit a variogram model that will be a valid variogram, as is done in EstimatedVariogramModel.
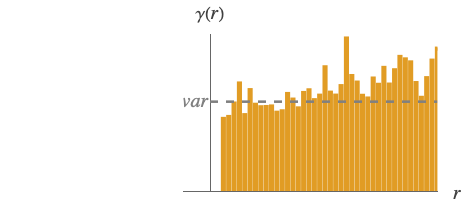
 - From the binned variogram, one can detect whether there is a trend in the data, which will result in an unbounded variogram.
- The following options can be given:
-
DistanceFunction Automatic specify the function to compute distance Method "NonLattice" specify the shape of the locations for binning SpatialTrendFunction None specify the global trend model - The following settings can be used for Method:
-
"NonLattice" locations are given as a collection - The following Method options can be used:
-
"BinCenter" "Centroid" how to compute bin centers "MaxDistanceRatio" 1/3 data pairs for which the ratio of their distance to the max pair distance is greater are dropped "MinPairs" 30 bins containing fewer pairs are dropped "ScaleEstimator" "Cressie" which scale estimator to use - The following settings can be used for "ScaleEstimator":
-
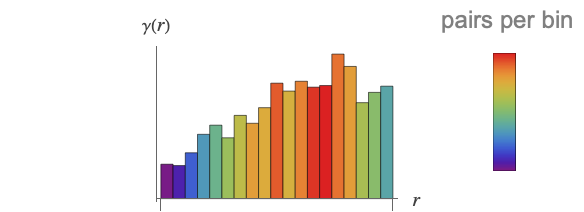
"Cressie" use the fourth moment of square root "Matheron" use the second moment "Qn" use QnDispersion "Sn" use SnDispersion - BinnedVariogram returns two-dimensional WeightedData, with weights being the number of pairs for each distance bin.
Examples
open all close allBasic Examples (2)
Compute BinnedVariogramList from data:
locations = {...};
vals = {...};PointValuePlot[locations -> vals]BinnedVariogramList[locations -> vals]ListPlot[%, Filling -> Axis]Compute BinnedVariogramList from geo data:
data = ResourceData["Sample Data: US Ozone 2021"]PointValuePlot[data, ColorFunction -> "Rainbow"]Specify values via annotation key:
BinnedVariogramList[data -> "Ozone"]ListPlot[%, Filling -> Axis]Scope (3)
Basic Uses (3)
Compute the binned variogram for a list of location-value pairs:
data = {...};data[[ ;; 2]]PointValuePlot[data, PlotLegends -> Automatic]bv = BinnedVariogramList[data]Visualize the binned variogram with weights being the number of pairs for each distance bin:
PointValuePlot[bv["InputData"] -> bv["InputWeights"], ColorFunction -> "Rainbow", PlotLegends -> Automatic]Use HistogramList specs for binning:
SeedRandom["bingo"];
locations = RandomPoint[Disk[], 100];
values = Exp[-Total /@ locations] + RandomReal[1, 100];PointValuePlot[locations -> values, PlotLegends -> Automatic]Compute binned variogram with Automatic bin specification:
ev0 = BinnedVariogramList[locations -> values];ev1 = BinnedVariogramList[locations -> values, 5];ev2 = BinnedVariogramList[locations -> values, {.01}];Use a named binning method (Scott is default):
ev3 = BinnedVariogramList[locations -> values, "Knuth"];ListLinePlot[{ev0, ev1, ev2, ev3}, PlotRange -> All, PlotLegends -> {"ev0", "ev1", "ev2", "ev3"}]Compute BinnedVariogramList for geographical data:
locs = GeoPosition[{{25.5, -124.5}, {25.5, -123.5}, {25.5, -122.5}, {25.5, -121.5}, {25.5, -120.5},
  {25.5, -112.5}, {25.5, -111.5}, {25.5, -110.5}, {25.5, -109.5}, {25.5, -108.5}, {25.5, -107.5},
  {25.5, -106.5}, {25.5, -105.5}, {25.5, -104.5}, {25.5 ... 8.5, -87.5}, {48.5, -86.5},
  {48.5, -85.5}, {48.5, -84.5}, {48.5, -83.5}, {48.5, -82.5}, {48.5, -81.5}, {48.5, -80.5},
  {48.5, -79.5}, {48.5, -78.5}, {48.5, -72.5}, {48.5, -71.5}, {48.5, -70.5}, {48.5, -69.5},
{48.5, -68.5}, {48.5, -67.5}}];ozone = {...};PointValuePlot[locs -> ozone, ColorFunction -> "Rainbow"]bv = BinnedVariogramList[locs -> ozone]ListPlot[bv, AxesLabel -> {"m"}]Options (7)
DistanceFunction (1)
For non-geographical locations, different DistanceFunction can be used:
locs = {...};
vals = {...};bv1 = BinnedVariogramList[locs -> vals, DistanceFunction -> ManhattanDistance]EuclideanDistance is the default distance function for Cartesian coordinates:
bv2 = BinnedVariogramList[locs -> vals, DistanceFunction -> EuclideanDistance]bv3 = BinnedVariogramList[locs -> vals, DistanceFunction -> (Norm[#1 - #2, 3]&)]ListPlot[{bv1, bv2, bv3}, PlotStyle -> PointSize[0.015], PlotLegends -> {"p = 1", "p = 2", "p = 3"}]Method (5)
Method (1)
BinCenter (1)
Compute BinnedVariogramList for various "BinCenter" specifications:
data = RandomPointConfiguration[MaternPointProcess[50, 20, .1, 2], Rectangle[]]["Points"];
vals = Sin[Norm /@ data];PointValuePlot[data -> vals, PlotLegends -> Automatic]center = {"Centroid", Mean, SpatialMedian};res = Map[BinnedVariogramList[data -> vals, Method -> {"NonLattice", "BinCenter" -> #}]&, center]ListPlot[res, PlotStyle -> PointSize[.02], PlotRange -> All, PlotLegends -> center]MaxDistanceRatio (1)
Compute BinnedVariogramList for various "MaxDistanceRatio" specifications:
data = RandomReal[1, {200, 2}];
vals = Sin[Norm /@ data];PointValuePlot[data -> vals, PlotLegends -> Automatic]Specify "MaxDistanceRatio" settings:
mdr = {.2, .4, .6, .8};res = Map[BinnedVariogramList[data -> vals, Method -> {"NonLattice", "MaxDistanceRatio" -> #}]&, mdr]ListPlot[First[#], PlotRange -> {{0, .9}, {0, .1}}, PlotStyle -> PointSize[0.02], PlotLabel -> Last[#], ImageSize -> 200]& /@ Transpose[{res, mdr}]MinPairs (1)
Compute BinnedVariogramList for various "MinPairs" specifications:
data = RandomReal[1, {100, 2}];
vals = Sin[Norm /@ data];PointValuePlot[data -> vals, PlotLegends -> Automatic]mp = {10, 50, 80, 100};res = Map[BinnedVariogramList[data -> vals, Method -> {"NonLattice", "MinPairs" -> #}]&, mp]ListPlot[First[#], PlotRange -> {{0, .5}, All}, PlotLabel -> Last[#], Ticks -> {{0, .1, .2, .3}, {0, .01, .02, .03}}, ImageSize -> 200]& /@ Transpose[{res, mp}]ScaleEstimator (1)
Compute BinnedVariogramList for various "ScaleEstimator" specifications:
data = RandomReal[1, {500, 2}];
vals = Sin[Norm /@ data];PointValuePlot[data -> vals, PlotLegends -> Automatic]Specify "ScaleEstimator" settings:
est = {"Cressie", "Matheron", "Qn", "Sn"};res = Map[BinnedVariogramList[data -> vals, Method -> {Automatic, "ScaleEstimator" -> #}]&, est]ListPlot[res, PlotLegends -> est]SpatialTrendFunction (1)
By default, BinnedVariogramList assumes no trend, but the data can be automatically detrended:
SeedRandom["bingo"];
locs = RandomPoint[Disk[], 100];
vals = Exp[-Total /@ locs] + RandomReal[1, 100];PointValuePlot[locs -> vals, PlotLegends -> Automatic]Specify trend settings using SpatialTrendFunction and compute binned variogram:
trends = {1, 2, (1 / Exp[Total@#]&)};
res = Map[BinnedVariogramList[locs -> vals, SpatialTrendFunction -> #]&, trends]
The plot shows that data has a trend of at least first order:
ListLinePlot[res, PlotLegends -> trend]Applications (2)
Binned variogram can be used to get initial visual shape idea for EstimatedVariogramModel:
data = ResourceData["Sample Data: US Ozone 2021"]Compute binned variogram for values specified by the annotation key:
bv = BinnedVariogramList[data -> "Ozone"]ListPlot[bv]Fit a few models with slow initial variation:
models = {"Cubic", "Spherical", "Gaussian", "Askey"};vars = Map[EstimatedVariogramModel[data -> "Ozone", #]&, models];Grid[Partition[MapThread[#1["Visualization", PlotLabel -> #2]&, {vars, models}], 2]]BinnedVariogramList can be used to indicate the presence of trend in the data:
SeedRandom["trendy"];
locs = RandomPoint[Disk[], 100];
vals = Exp[-Total /@ locs] + RandomReal[1, 100];PointValuePlot[locs -> vals, PlotLegends -> Automatic]Compute binned variogram with no trend specification:
bv0 = BinnedVariogramList[locs -> vals]The plot shows that data has a trend:
ListLinePlot[bv0]Compute binned variogram with linear trend:
bv1 = BinnedVariogramList[locs -> vals, SpatialTrendFunction -> 1]Compare the linearly detrended binned variogram with the default:
ListLinePlot[{bv0, bv1}, PlotLegends -> {"no trend", "linear trend"}]Possible Issues (1)
BinnedVariogramList will fail if there is not enough data to meet the minimum number of pairs per bin requirement:
locs = RandomReal[1, {4, 2}];
vals = RandomReal[1, 4];BinnedVariogramList[locs -> vals]Text
Wolfram Research (2021), BinnedVariogramList, Wolfram Language function, https://reference.wolfram.com/language/ref/BinnedVariogramList.html.
CMS
Wolfram Language. 2021. "BinnedVariogramList." Wolfram Language & System Documentation Center. Wolfram Research. https://reference.wolfram.com/language/ref/BinnedVariogramList.html.
APA
Wolfram Language. (2021). BinnedVariogramList. Wolfram Language & System Documentation Center. Retrieved from https://reference.wolfram.com/language/ref/BinnedVariogramList.html