Introduction to Graph Drawing

The Wolfram Language provides functions for the aesthetic drawing of graphs. Algorithms implemented include spring embedding, spring-electrical embedding, high-dimensional embedding, radial drawing, random embedding, circular embedding, and spiral embedding. In addition, algorithms for layered/hierarchical drawing of directed graphs as well as for the drawing of trees are available. These algorithms are implemented via four functions: GraphPlot, GraphPlot3D, LayeredGraphPlot, and TreePlot.
GraphPlot
generate a plot of a graph
GraphPlot3D
generate a 3D plot of a graph
LayeredGraphPlot
generate a layered plot of a graph
TreePlot
generate a tree plot of a graph
Functions for graph drawing.
GraphPlot and GraphPlot3D are suitable for straight line drawing of general graphs. LayeredGraphPlot attempts to draw the vertices of a graph in a series of layers; therefore it is most suitable for applications such as the drawing of flow charts. TreePlot is particularly useful for drawing trees or tree-like graphs. These functions are designed to work efficiently for very large graphs.
This shows a graph drawn using each of the four functions:
In these functions, a graph is represented either by a list of rules of the form {vi1->vj1,}, where vi1 and vj1 are vertices, or by the adjacency matrix of the graph.
Graph Theory Notations
A graph consists of a set of vertices (also called nodes) and a set of edges . Two vertices and form an edge of the graph if .
If implies that , then is an undirected graph. Otherwise it is a directed graph. The former can be drawn using line segments, while the latter can be drawn with arrows. In an undirected graph, it is often convenient to denote that an edge exists between and with the notation .
For example, this is a directed graph:
Here is an undirected graph:
Input Formats
In the Wolfram Language, graphs can be represented by one of the following three data structures. A graph can be represented by a list of rules.
For example, represents the following directed graph:
A graph can also be represented by its adjacency matrix. Let be a directed graph. Assuming that the vertices are indices from to , that is, , then the adjacency matrix of is an × matrix, with entries if and otherwise.
The following adjacency matrix represents the same directed graph.
An undirected graph, on the other hand, is represented by a symmetric adjacency matrix. The matrix entries if and otherwise.
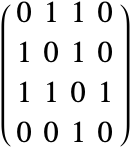
This adjacency matrix represents the undirected graph that follows it.
Because of the zero entries in an adjacency matrix, it is often convenient to represent the matrix using a SparseArray.
The previous matrix can be written as the following sparse array:
Graph Drawing Algorithms
Graphs are often used to encapsulate the relationship between items. Graph drawing enables visualization of these relationships. The usefulness of the visual representation depends upon whether the drawing is aesthetic. While there are no strict criteria for aesthetic drawing, it is generally agreed that such a drawing has minimal edge crossing and even spacing between vertices. This problem has been studied extensively in the literature [1], and many approaches have been proposed. Two popular straight-edge drawing algorithms, the spring embedding and spring-electrical embedding, work by minimizing the energy of physical models of the graph. The high-dimensional embedding method, on the other hand, embeds a graph in high-dimensional space and then projects it back to two- or three-dimensional space. In addition, there are algorithms for drawing directed graphs in a hierarchical fashion, as well as for drawing trees. Random embedding, circular embedding, and spiral embedding do not utilize any connectivity information for laying out a graph, and therefore are not described any further here.

Spring Embedding

The spring embedding algorithm assigns force between each pair of nodes. When two nodes are too close together, a repelling force comes into effect. When two nodes are too far apart, they are subject to an attractive force. This scenario can be illustrated by linking the vertices with springshence the name "spring embedding".
This algorithm works by adding springs to all edges and adding looser springs to all vertex pairs that are not adjacent. Thus, in two dimensions, the total energy of the system is
Here, and are the coordinate vectors of nodes and , and is the Euclidean distance between them. is the natural length of the spring between vertex and vertex , and can be chosen as the graph distance between and . The parameters are the strength of the springs, where is a parameter representing the strength of the springs. is the number of vertices.
The layout of the graph vertices is calculated by minimizing this energy function. One way to minimize the energy function is by iteratively moving each of the vertices along the direction of the spring force until an approximate equilibrium is reached. Multilevel techniques are used to overcome local minima.
Spring embedding works particularly well for problems like regular grid graphs, in which it is possible to lay out the graph so that Euclidean distances between vertices are proportional to the graph distances.
This draws a 20×20 grid graph using the spring embedding algorithm:
This method does, however, require more memory and CPU time. To reduce its complexity, vertices that are far apart are ignored in the calculation of force and energy. See the method option "InferentialDistance" of GraphPlot and GraphPlot3D for more information.

Spring-Electrical Embedding

The disadvantage of the spring embedding algorithm is that it requires knowing the graph distance between every pair of vertices. Spring-electrical embedding uses two forces. The attractive force, , is restricted to adjacent vertices and is proportional to the Euclidean distance between them, where is related to the natural spring length. The electrical force, , on the other hand, is global and is inversely proportional to the Euclidean distance between nodes and . Overall, the energy to be minimized is , where
Here, is a constant that regulates the relative strength of the repulsive and attractive forces, and is the Euclidean distance between nodes and . For a graph of two vertices, the ideal Euclidean distance between the vertices is , which gives a total energy of zero.
The layout of the graph vertices is calculated by minimizing the energy function. One way to do this is by iteratively moving each of the vertices along the direction of the spring force until an approximate equilibrium is reached. Multilevel techniques [7] are used to overcome local minima, and an octree data structure [16] is used to reduce the computational complexity in some cases.
In general, spring-electrical embedding works well for most problems. With multilevel and octree techniques, it is implemented very efficiently with a complexity of about .
This shows the drawing of a 20×20 grid graph using "SpringElectricalEmbedding":
A side effect of this algorithm is that vertices at the periphery tend to be closer to each other than those in the center, as seen in the previous drawing. This tendency can be alleviated with the method option "RepulsiveForcePower", which is described in "General Graph Drawing".

High-Dimensional Embedding Algorithm

In the high-dimensional embedding method, a graph is embedded in high-dimensional space, and then projected back to two- or three-dimensional space. First, a -dimensional coordinate system is created based on centers. The centers are a set of vertices that are chosen to be as far apart as possible. The first vertex is selected at random, and then each of the remaining centers is chosen as the farthest vertex from the previously selected centers. In other words, if centers have been selected, is the vertex whose shortest graph distance to the centers is larger than or equal to the shortest graph distance of all the other vertices to the centers.
With these centers, a -dimensional coordinate system can be established. Each vertex has the coordinates , where is the graph distance between the vertex and the center . The -dimensional coordinate vectors form an × matrix , where is the th row of .
Since it is only possible to draw in two and three dimensions, and since the coordinates are correlated, the -dimensional coordinates are projected back to two or three dimensions by a suitable linear combination. Assume that the graph with coordinates and centers is projected back to two dimensions. In order to make this projection shift-invariant, is first normalized to .
Let and be two such -dimensional vectors. They should be uncorrelated, so they must be orthogonal to each other.
Each must be as far away from 0 as possible.
To achieve this, you therefore select and to be the two eigenvectors that correspond to the first two largest eigenvalues of the × symmetric matrix . This process of choosing two highly uncorrelated vectors is also known as principal component analysis.
In summary, for two-dimensional drawing, the high-dimensional embedding method uses the coordinates of the vertices given by and
This shows the drawing of a 20×20 grid graph using "HighDimensionalEmbedding":
The high-dimensional embedding method tends to be very fast but its results are often of lower quality than force-directed algorithms. The method can be specified with Method->"HighDimensionalEmbedding" in GraphPlot and GraphPlot3D.

A Hierarchical Drawing Algorithm for Directed Graphs

The algorithm for drawing directed acyclic graphs (DAGs) follows the algorithm of Sugiyama et al. [14], and subsequent development [15]. It consists of the following stages:

1.  Vertices of the DAG are first assigned a preliminary ranking such that if there is an edge from to , then it is likely that . This is to ensure that the final drawing has directed edges pointing mostly downward.

2.  The coordinates are generated so that if there is an edge from to and , their coordinates are as close as possible, but separated by a set minimum. This ensures that the final resulting drawing does not have many long edges. This process assigns the vertices into a finite number of layers. If an edge lies across a number of layers, virtual vertices are added.

3.  A preliminary ranking is assigned to each vertex to minimize the number of edge crossings.

4.  The coordinates are generated by minimizing subject to the constraints that vertices on the same layer obey the ranking generated in step 3 and are separated by a set minimum.

The resulting drawing lays out the graph in a hierarchical structure, where most of the edges point downward. LayeredGraphPlot function implements this algorithm.

Algorithms for Drawing Trees

Two algorithms for drawing trees are the radial drawing algorithm and the layered drawing algorithm [1]. In the radial drawing algorithm, a reasonable root of the tree is chosen. Then, starting from that root of the tree, each subtree is drawn inside a wedge, with the angle of the wedge proportional to the number of leaves in that subtree. In the layered drawing algorithm, a reasonable root of the tree is chosen. Then, starting from that root, subtrees of the root are recursively drawn such that vertices on the same level have the same coordinate, and the horizontally closest vertices of adjacent subtrees are of unit distance apart. The root is placed at the center of the coordinates of its subtrees and its coordinate is one unit above them. TreePlot function chooses between these two algorithms, depending on the second argument of this function.
Selecting the Appropriate Graph Drawing Function
For general graph drawing, consider using GraphPlot or GraphPlot3D. GraphPlot or GraphPlot3D calculates a visually appealing 2D/3D layout and plots the graph using this layout. See "General Graph Drawing" for these functions, and [17] for algorithmic details.
To get a layered/hierarchical drawing of a directed graph, use LayeredGraphPlot. LayeredGraphPlot attempts to draw the vertices of a graph in a series of layers, with dominant vertices at the top, and vertices lower in the hierarchy progressively farther down. This function is most suitable for applications such as flow chart drawing. See "Hierarchical Drawing of Directed Graphs" for this function.
TreePlot is specifically designed to draw trees and tree-like graphs. See "Tree Drawing" for this function.
References

[1] Di Battista, G., P. Eades, R. Tamassia, and I. G. Tollis. Graph Drawing: Algorithms for the Visualization of Graphs. Prentice Hall, 1999.

[2] Fruchterman, T. M. J. and E. M. Reingold. "Graph Drawing by Force-Directed Placement." SoftwarePractice and Experience 21, no. 11 (1991): 11291164.

[3] Eades, P. "A Heuristic for Graph Drawing." Congressus Numerantium 42 (1984): 149160.

[4] Quinn, N. and M. Breuer. "A Force Directed Component Placement Procedure for Printed Circuit Boards." IEEE Trans. on Circuits and Systems 26, no. 6 (1979): 377388.

[5] Kamada, T. and S. Kawai. "An Algorithm for Drawing General Undirected Graphs." Information Processing Letters 31 (1989): 715.

[6] Harel, D. and Y. Koren. "Graph Drawing by High-Dimensional Embedding." In Proceedings of 10th Int. Symp. Graph Drawing (GD'02), 207219, 2002.

[7] Walshaw, C. "A Multilevel Algorithm for Force-Directed Graph-Drawing." J. Graph Algorithms Appl. 7, no. 3 (2003): 253285.

[8] Cuthill, E. and J. McKee. "Reducing the Bandwidth of Sparse Symmetric Matrices." In Proceedings, 24th National Conference of ACM, 157172, 1969.

[9] Lim, A., B. Rodrigues, and F. Xiao. "A Centroid-Based Approach to Solve the Bandwidth Minimization Problem." In Proceedings of the 37th Annual Hawaii International Conference on System Sciences (HICSS'04), 30075.1, 2004.

[10] Barnard, S. T., A. Pothen, and H. D. Simon. "A Spectral Algorithm for Envelope Reduction of Sparse Matrices." Journal of Numerical Linear Algebra with Applications 2, no. 4 (1995): 317334.

[11] Sloan, S. "A Fortran Program for Profile and Wavefront Reduction." International Journal for Numerical Methods in Engineering 28, no. 11 (1989): 26512679.

[12] Reid, J. K. and J. A. Scott. "Ordering Symmetric Sparse Matrices for Small Profile and Wavefront." International Journal for Numerical Methods in Engineering 45, no. 12 (1999): 17371755.

[13] George, J. A. "Computer Implementation of the Finite-Element Method." Report STAN CS-71-208, PhD Thesis, Department of Computer Science, Stanford University, Stanford, California, 1971.

[14] Sugiyama, K., S. Tagawa, and M. Toda. "Methods for Visual Understanding of Hierarchical Systems." IEEE Trans. Syst. Man, Cybern. 11, no. 2 (1981): 109125.

[15] Gansner, E. R., E. Koutsofios, S. C. North, and K. P. Vo. "A Technique for Drawing Directed Graphs." IEEE Trans. Software Engineering 19, no. 3 (1993): 214230.

[16] Quigley, A. "Large Scale Relational Information Visualization, Clustering, and Abstraction." PhD Thesis, Department of Computer Science and Software Engineering, University of Newcastle, Australia, 2001.

[17] Hu, Y. F. "Efficient, High-Quality Force-Directed Graph Drawing." The Mathematica Journal 10, no. 1 (2006): 3771.