Change the Style of Points in a 2D Scatter Plot
Make a scatter plot
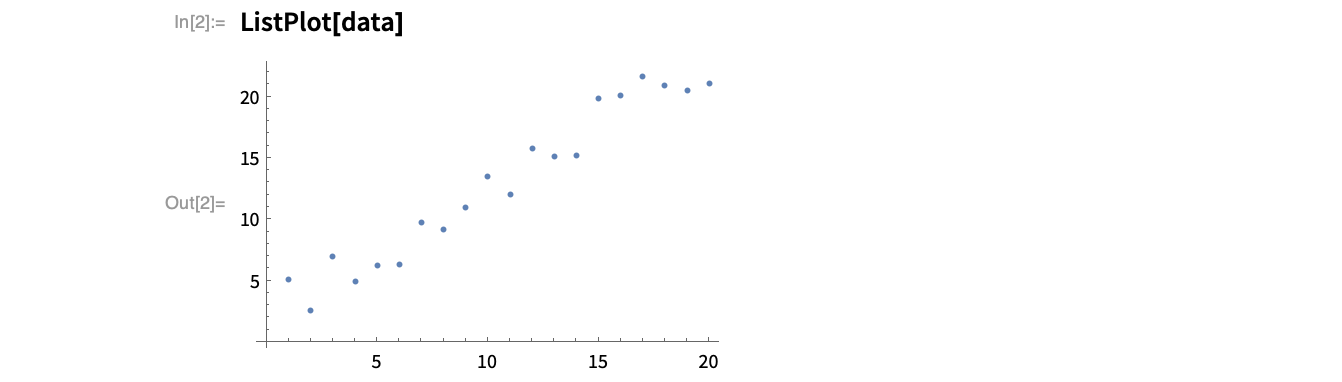
Generate some data to plot:
Plot the data in a scatter plot. By default, the points are marked with blue dots:
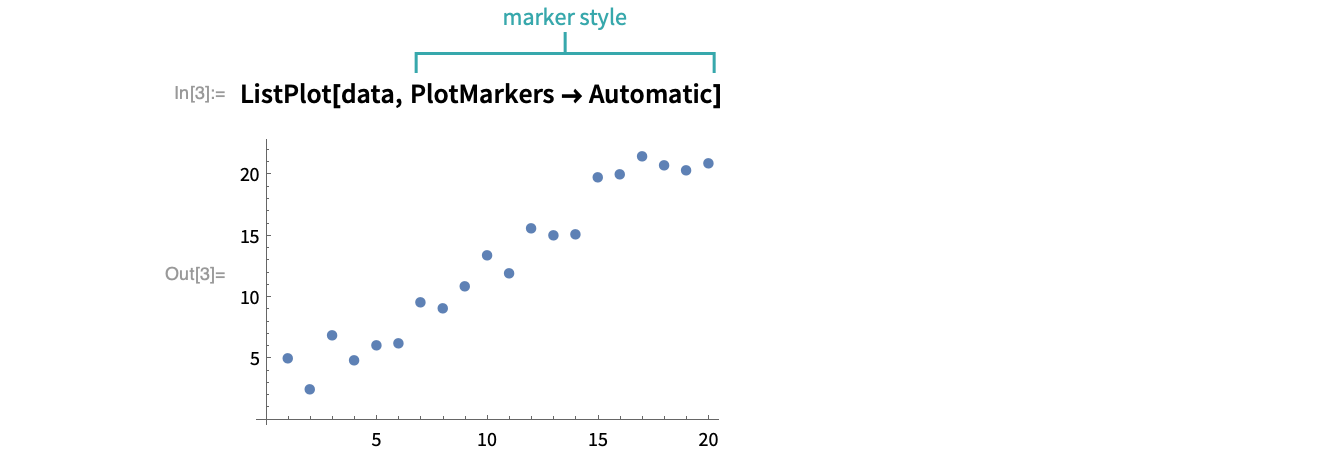
Change the size of the plot points
Specify PlotMarkersAutomatic to get slightly larger points:
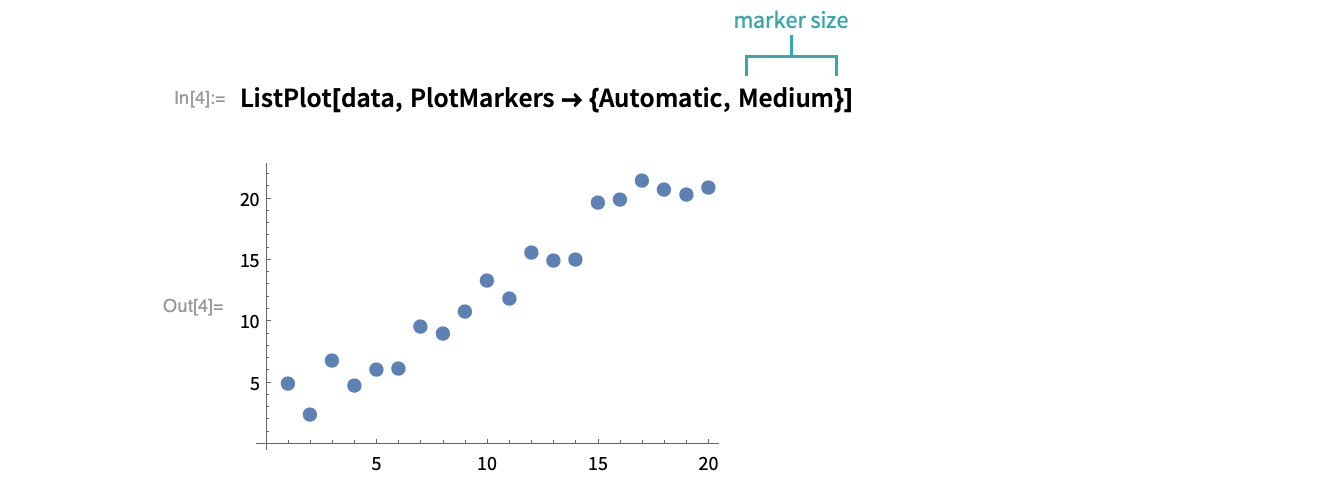
Use a preset size value:
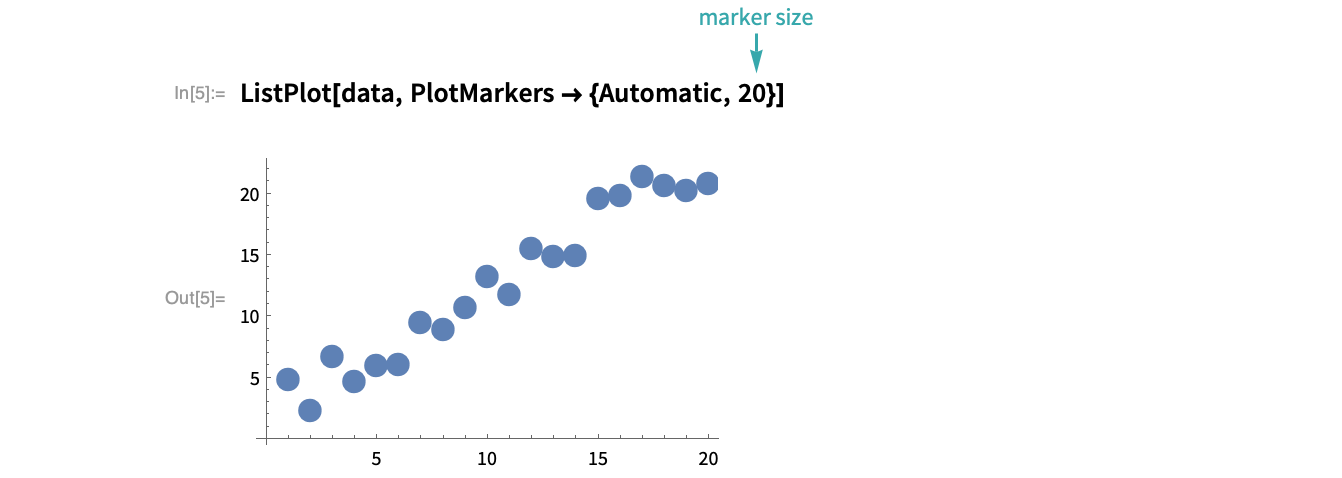
Give a numeric size value:
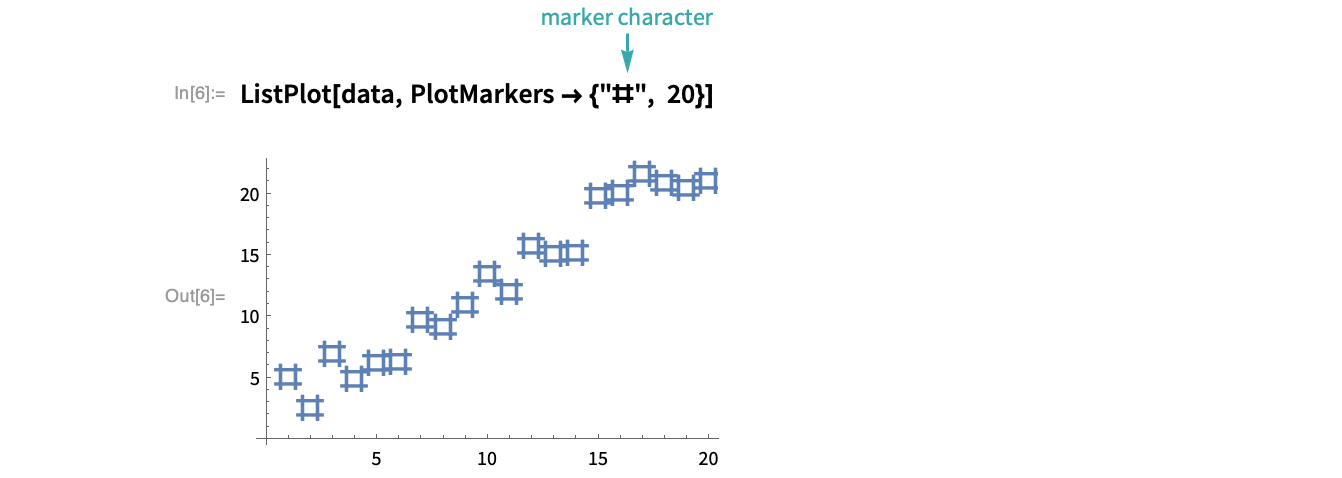
Mark plot points with custom shapes
Use a character to mark plot points:
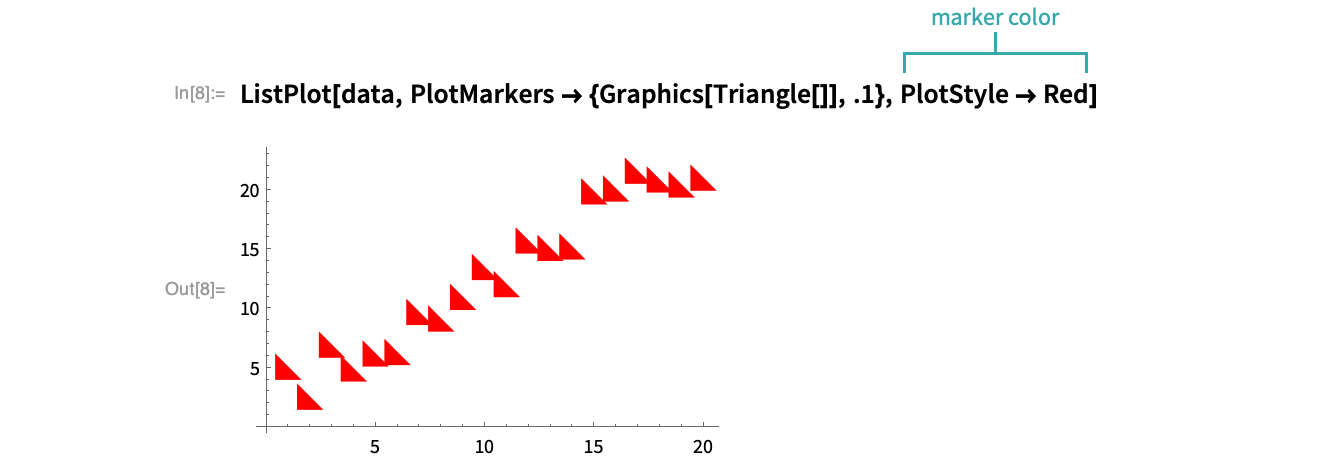
Use a custom shape to mark plot points:

Change the color of plot markers
Use PlotStyle to specify the color of plot markers:
Notes
Differentiate multiple collections of data using custom plot markers: