WOLFRAM SYSTEM MODELER
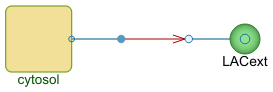
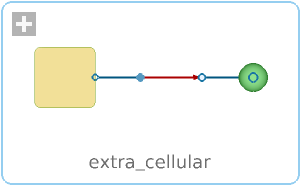
extra_cellularMain model of the example |
|
Diagram
Wolfram Language
In[1]:=
SystemModel["BioChem.Examples.CentralMetabolism.extra_cellular"]
Out[1]:=
Information
This model describes the energy metbolism of a human muscle.
The model simulates the processes of utilization of energy stored in the form of glycogen. This is the main energy supply of working muscle. The pathway includes glycolytic and TCA cycle reactions stoichiometrically connected with synthesis ATP, which is used mainly for mechanical work (ATPase). The biochemical scheme of the simulated processes is shown in Fig. 1.
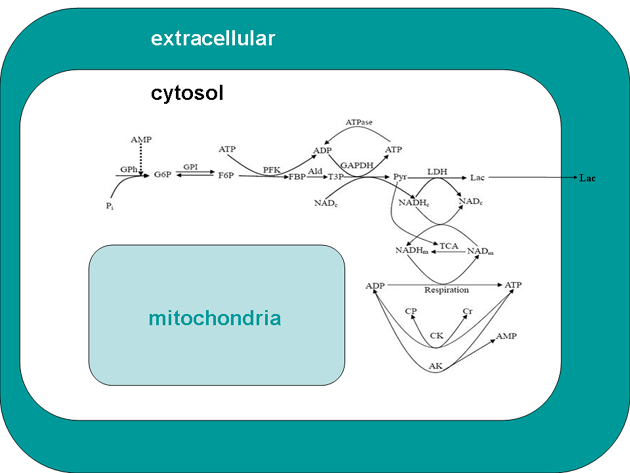
Fig 1. Scheme of glycolysis and coupled processes simulated in the model: consumption and synthesis of ATP and transformation of reducing equivalents of NADH. The relevant equations, which account for stoichiometry of the ATP production, are given in supplementary materials. One molecule of ATP is consumed per molecule of fructose 6-phosphate in the phosphofructokinase reaction; two molecules of ATP per molecule of triose phospate (four molecules per hexose molecule) are then produced on the way to pyruvate; 2.5 molecules of ATP are produced when one molecule of NADH is oxidized. Cytosolic NADH is produced in the reaction of glyceraldehyde-3-phosphate dehydrogenase and consumed when pyruvate is transformed to lactate. In mitochondria one molecule of NADH is produced in the pyruvate dehydrogenase reaction and then three NADH molecules and one FADH2 molecule in the tricarboxylate cycle. Abbreviations: AK, adenylate kinase (EC 2.7.4.3); CK, creatine kinase (EC 2.7.3.2); CP, phosphocreatine; Cr, creatine; F6P, fructose 6-phosphate; FBP, fructose 1,6-bisphosphate; G6P, glucose 6-phosphate; GAPDH, glyceraldehyde-3-phosphate dehydrogenase (EC 1.2.1.12); GPh, glycogen phosphorylase (EC 2.4.1.1); Lac, lactate; LDH, lactate dehydrogenase (EC 1.1.1.27); PFK, phosphofructokinase (EC 2.7.1.11); GPI, glucose phosphate isomerase (EC 5.3.1.9.); Pyr, pyruvate. Subscripts: m, mitochondrial; c, cytosolic.
This model was used to study the biochemical effects of training programs, which consisted of 14 training sessions either with 24 (short period, SP) or 72 hour (long period, LP) intervals between the individual sessions (Parra et al, 2000). In this example the analyzed data included the change in enzyme activities after both types of training as Table 1 shows.
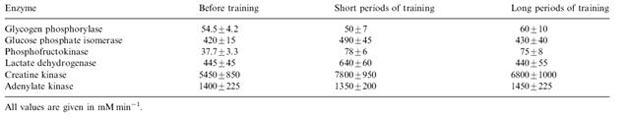
Table 1 Measured enzyme activity in biopsy before and after training (Parra et al, 2000).
Moreover, the concentrations of metabolites at rest and after 30 seconds of maximal intensity exercise were measured before and after accomplishing the training programs. The measured metabolites are adenine nucleotides and the forms of creatine (Table 2) and intermediates of glycolysis (Table 3).
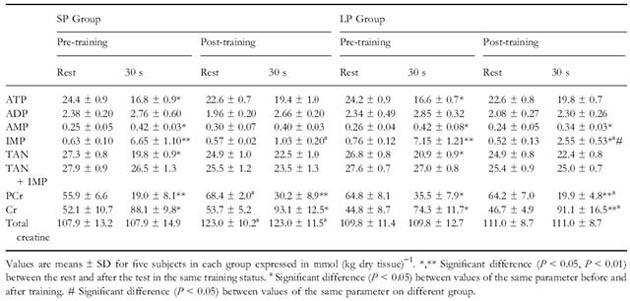
Table 2 Concentrations of metabolites at rest and after 30s of maximal intensity exercise.
The model simulates the experimental data as an example in Fig. 2 shows. The switch from rest to maximal intensity exercise in the model simulation is induced by the change of only one parameter, an increase of ATPase activity; stimulation of all the metabolic fluxes is a result of activation by the products of ATP hydrolysis.
The simulation has shown that after short periods of training the glycolytic flux at rest was three times higher than it had been before training, whereas during exercise the flux and energy consumption remained the same as before training. Long periods of training had less effect on the glycolytic flux at rest, but increased it in response to exercise, increasing the contribution of oxidative phosphorylation. This model and data analysis are described in V. A. Selivanov, P. de Atauri, J. J. Centelles, J. Cadefau, J. Parra, R. Cussó, J. Carreras, M. Cascante, "The Changes in the Energy Metabolism of Human Muscle Induced by Training," Journal of Theoretical Biology, 252(3), 2008 pp. 402-410. doi:10.1016/j.jtbi.2007.09.039.
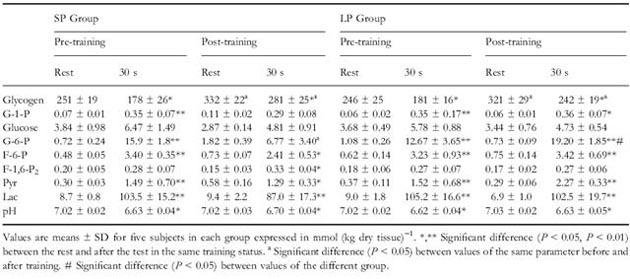
Table 3 Concentrations of metabolites at rest and after 30 seconds of maximal intensity exercise.
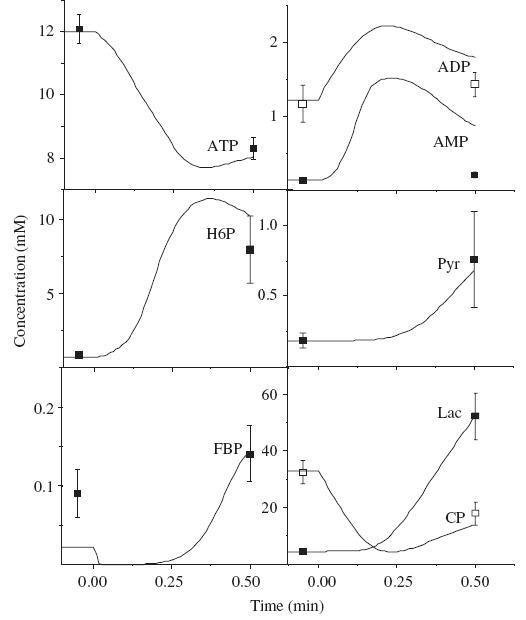
Fig. 2. Time courses of high-energy phosphates and glycolytic intermediates during 30 seconds of maximal exercise before training. Points with error bars are experimental metabolite concentrations at rest and after 30 seconds of exercise. For simulation at the beginning of exercise (time=0), ATPase activity increased from 3.2 to 200 mM min-1. Other parameters are given in Table 1 and supplementary materials. Abbreviations are given in Figure 1.
If simulated for more than 0.5 minutes the model has numerical problems. In real life, a person cannot maintain maximal intensity exercise; fatigue comes and the intensity decreases. So, steady state at maximal intensity does not exist in real life either.
The model simulates the processes of utilization of energy stored in the form of glycogen. This is the main energy supply of working muscle. The pathway includes glycolytic and TCA cycle reactions stoichiometrically connected with synthesis ATP, which is used mainly for mechanical work (ATPase). The biochemical scheme of the simulated processes is shown in Fig. 1.
Fig 1. Scheme of glycolysis and coupled processes simulated in the model: consumption and synthesis of ATP and transformation of reducing equivalents of NADH. The relevant equations, which account for stoichiometry of the ATP production, are given in supplementary materials. One molecule of ATP is consumed per molecule of fructose 6-phosphate in the phosphofructokinase reaction; two molecules of ATP per molecule of triose phospate (four molecules per hexose molecule) are then produced on the way to pyruvate; 2.5 molecules of ATP are produced when one molecule of NADH is oxidized. Cytosolic NADH is produced in the reaction of glyceraldehyde-3-phosphate dehydrogenase and consumed when pyruvate is transformed to lactate. In mitochondria one molecule of NADH is produced in the pyruvate dehydrogenase reaction and then three NADH molecules and one FADH2 molecule in the tricarboxylate cycle. Abbreviations: AK, adenylate kinase (EC 2.7.4.3); CK, creatine kinase (EC 2.7.3.2); CP, phosphocreatine; Cr, creatine; F6P, fructose 6-phosphate; FBP, fructose 1,6-bisphosphate; G6P, glucose 6-phosphate; GAPDH, glyceraldehyde-3-phosphate dehydrogenase (EC 1.2.1.12); GPh, glycogen phosphorylase (EC 2.4.1.1); Lac, lactate; LDH, lactate dehydrogenase (EC 1.1.1.27); PFK, phosphofructokinase (EC 2.7.1.11); GPI, glucose phosphate isomerase (EC 5.3.1.9.); Pyr, pyruvate. Subscripts: m, mitochondrial; c, cytosolic.
This model was used to study the biochemical effects of training programs, which consisted of 14 training sessions either with 24 (short period, SP) or 72 hour (long period, LP) intervals between the individual sessions (Parra et al, 2000). In this example the analyzed data included the change in enzyme activities after both types of training as Table 1 shows.
Table 1 Measured enzyme activity in biopsy before and after training (Parra et al, 2000).
Moreover, the concentrations of metabolites at rest and after 30 seconds of maximal intensity exercise were measured before and after accomplishing the training programs. The measured metabolites are adenine nucleotides and the forms of creatine (Table 2) and intermediates of glycolysis (Table 3).
Table 2 Concentrations of metabolites at rest and after 30s of maximal intensity exercise.
The model simulates the experimental data as an example in Fig. 2 shows. The switch from rest to maximal intensity exercise in the model simulation is induced by the change of only one parameter, an increase of ATPase activity; stimulation of all the metabolic fluxes is a result of activation by the products of ATP hydrolysis.
The simulation has shown that after short periods of training the glycolytic flux at rest was three times higher than it had been before training, whereas during exercise the flux and energy consumption remained the same as before training. Long periods of training had less effect on the glycolytic flux at rest, but increased it in response to exercise, increasing the contribution of oxidative phosphorylation. This model and data analysis are described in V. A. Selivanov, P. de Atauri, J. J. Centelles, J. Cadefau, J. Parra, R. Cussó, J. Carreras, M. Cascante, "The Changes in the Energy Metabolism of Human Muscle Induced by Training," Journal of Theoretical Biology, 252(3), 2008 pp. 402-410. doi:10.1016/j.jtbi.2007.09.039.
Table 3 Concentrations of metabolites at rest and after 30 seconds of maximal intensity exercise.
Fig. 2. Time courses of high-energy phosphates and glycolytic intermediates during 30 seconds of maximal exercise before training. Points with error bars are experimental metabolite concentrations at rest and after 30 seconds of exercise. For simulation at the beginning of exercise (time=0), ATPase activity increased from 3.2 to 200 mM min-1. Other parameters are given in Table 1 and supplementary materials. Abbreviations are given in Figure 1.
Limitations
The time scale of the model is minutes, so it simulates 0.5 minutes of maximal intensity exercise. The model produces the same results as seen from experiments.If simulated for more than 0.5 minutes the model has numerical problems. In real life, a person cannot maintain maximal intensity exercise; fatigue comes and the intensity decreases. So, steady state at maximal intensity does not exist in real life either.
References
J. Parra, J. A. Cadefau, G. Rodas, N. Amigó, and R. Cussó, "The Distribution of Rest Periods Affects Performance and Adaptations of Energy Metabolism Induced by High-Intensity Training in Human Muscle," Acta Physiologica Scandinavica, 169(2), 2000, pp. 157-165 doi:10.1046/j.1365-201x.2000.00730.xParameters (23)
| mainCompartment |
Value: true Type: Boolean Description: Specifies whether the compartment is a main (top-level) compartment. Used in SBML import/export. |
|---|---|
| iv2 |
Value: 0.0999758 Type: Real |
| iv3 |
Value: 0.07427 Type: Real |
| iv4 |
Value: 0.148871 Type: Real |
| iv5 |
Value: 4.34299 Type: Real |
| iv6 |
Value: 0.00406177 Type: Real |
| iv7 |
Value: 1.72073e-005 Type: Real |
| iv8 |
Value: 0.0695775 Type: Real |
| iv9 |
Value: 28.2621 Type: Real |
| iv10 |
Value: 0.000398124 Type: Real |
| iv11 |
Value: 0.650608 Type: Real |
| nv19 |
Value: 1 Type: Real |
| nv20 |
Value: 1.14947 Type: Real |
| kamp |
Value: 0.008414710000000001 Type: Real |
| k2amp |
Value: 200 Type: Real |
| kadp |
Value: 0.05 Type: Real |
| k2adp |
Value: 84.7376 Type: Real |
| tan |
Value: 27.5 Type: Real |
| tcr |
Value: 54 Type: Real |
| kt |
Value: 0.08500000000000001 Type: Real |
| kh |
Value: 0.2 Type: Real |
| PNt |
Value: 139.117 Type: Real |
| iv1 |
Value: 0.603855 Type: Real |