


SmoothHistogram3D
SmoothHistogram3D[{{x1,y1},{x2,y2},…}]
plots a 3D smooth kernel histogram of the values {xi,yi}.
SmoothHistogram3D[{{x1,y1},{x2,y2},…},espec]
plots a 3D smooth kernel histogram with estimator specification espec.
SmoothHistogram3D[{{x1,y1},{x2,y2},…},espec,dfun]
plots the distribution function dfun.
SmoothHistogram3D[{data1,data2,…},…]
plots smooth kernel histograms for multiple datasets datai.
Details and Options
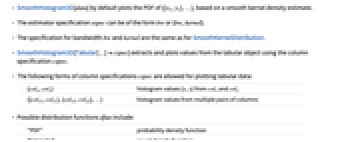
- SmoothHistogram3D[data] by default plots the PDF of {{x1,y1},…}, based on a smooth kernel density estimate.
- The estimator specification espec can be of the form bw or {bw,kernel}.
- The specification for bandwidth bw and kernel are the same as for SmoothKernelDistribution.
- SmoothHistogram3D[Tabular[…]cspec] extracts and plots values from the tabular object using the column specification cspec.
- The following forms of column specifications cspec are allowed for plotting tabular data:
-
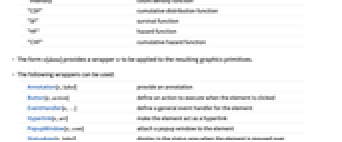
{colx,coly} histogram values {x,y} from colx and coly {{colx1,coly1},{colx2,coly2},…} histogram values from multiple pairs of columns - Possible distribution functions dfun include:
-
"PDF" probability density function "Intensity" count density function "CDF" cumulative distribution function "SF" survival function "HF" hazard function "CHF" cumulative hazard function - The form w[data] provides a wrapper w to be applied to the resulting graphics primitives.
- The following wrappers can be used:
-
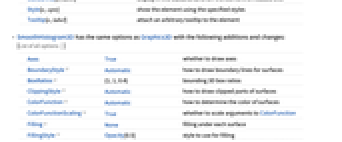
Annotation[e,label] provide an annotation Button[e,action] define an action to execute when the element is clicked EventHandler[e,…] define a general event handler for the element Hyperlink[e,uri] make the element act as a hyperlink PopupWindow[e,cont] attach a popup window to the element StatusArea[e,label] display in the status area when the element is moused over Style[e,opts] show the element using the specified styles Tooltip[e,label] attach an arbitrary tooltip to the element - SmoothHistogram3D has the same options as Graphics3D with the following additions and changes: [List of all options]
-
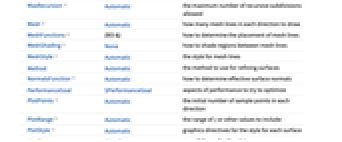
Axes True whether to draw axes BoundaryStyle Automatic how to draw boundary lines for surfaces BoxRatios {1,1,0.4} bounding 3D box ratios ClippingStyle Automatic how to draw clipped parts of surfaces ColorFunction Automatic how to determine the color of surfaces ColorFunctionScaling True whether to scale arguments to ColorFunction Filling None filling under each surface FillingStyle Opacity[0.5] style to use for filling MaxRecursion Automatic the maximum number of recursive subdivisions allowed Mesh Automatic how many mesh lines in each direction to draw MeshFunctions {#3&} how to determine the placement of mesh lines MeshShading None how to shade regions between mesh lines MeshStyle Automatic the style for mesh lines Method Automatic the method to use for refining surfaces NormalsFunction Automatic how to determine effective surface normals PerformanceGoal $PerformanceGoal aspects of performance to try to optimize PlotPoints Automatic the initial number of sample points in each direction PlotRange Automatic the range of z or other values to include PlotStyle Automatic graphics directives for the style for each surface PlotTheme $PlotTheme overall theme for the plot RegionFunction (True&) how to determine whether a point should be included ScalingFunctions None how to scale individual coordinates WorkingPrecision MachinePrecision the precision used in internal computations - The arguments supplied to RegionFunction, MeshFunctions, NormalsFunction, and ColorFunction are x, y, and f, where f can be the PDF, CDF, etc. of the distribution.
- With ScalingFunctions->{sx,sy,sz}, the
 coordinate is scaled using sx, the
  coordinate is scaled using sy, and the
  coordinate is scaled using sz.
 -
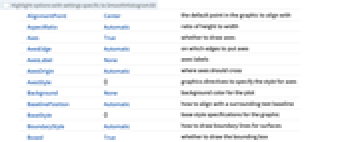
 Highlight options with settings specific to SmoothHistogram3D
-
AlignmentPoint Center the default point in the graphic to align with AspectRatio Automatic ratio of height to width Axes True whether to draw axes AxesEdge Automatic on which edges to put axes AxesLabel None axes labels AxesOrigin Automatic where axes should cross AxesStyle {} graphics directives to specify the style for axes Background None background color for the plot BaselinePosition Automatic how to align with a surrounding text baseline BaseStyle {} base style specifications for the graphic BoundaryStyle Automatic how to draw boundary lines for surfaces Boxed True whether to draw the bounding box BoxRatios {1,1,0.4} bounding 3D box ratios BoxStyle {} style specifications for the box ClippingStyle Automatic how to draw clipped parts of surfaces ClipPlanes None clipping planes ClipPlanesStyle Automatic style specifications for clipping planes ColorFunction Automatic how to determine the color of surfaces ColorFunctionScaling True whether to scale arguments to ColorFunction ContentSelectable Automatic whether to allow contents to be selected ControllerLinking False when to link to external rotation controllers ControllerPath Automatic what external controllers to try to use Epilog {} 2D graphics primitives to be rendered after the main plot FaceGrids None grid lines to draw on the bounding box FaceGridsStyle {} style specifications for face grids Filling None filling under each surface FillingStyle Opacity[0.5] style to use for filling FormatType TraditionalForm default format type for text ImageMargins 0. the margins to leave around the graphic ImagePadding All what extra padding to allow for labels, etc. ImageSize Automatic absolute size at which to render the graphic LabelStyle {} style specifications for labels Lighting Automatic simulated light sources to use MaxRecursion Automatic the maximum number of recursive subdivisions allowed Mesh Automatic how many mesh lines in each direction to draw MeshFunctions {#3&} how to determine the placement of mesh lines MeshShading None how to shade regions between mesh lines MeshStyle Automatic the style for mesh lines Method Automatic the method to use for refining surfaces NormalsFunction Automatic how to determine effective surface normals PerformanceGoal $PerformanceGoal aspects of performance to try to optimize PlotLabel None a label for the plot PlotPoints Automatic the initial number of sample points in each direction PlotRange Automatic the range of z or other values to include PlotRangePadding Automatic how much to pad the range of values PlotRegion Automatic final display region to be filled PlotStyle Automatic graphics directives for the style for each surface PlotTheme $PlotTheme overall theme for the plot PreserveImageOptions Automatic whether to preserve image options when displaying new versions of the same graphic Prolog {} 2D graphics primitives to be rendered before the main plot RegionFunction (True&) how to determine whether a point should be included RotationAction "Fit" how to render after interactive rotation ScalingFunctions None how to scale individual coordinates SphericalRegion Automatic whether to make the circumscribing sphere fit in the final display area Ticks Automatic specification for ticks TicksStyle {} style specification for ticks TouchscreenAutoZoom False whether to zoom to fullscreen when activated on a touchscreen ViewAngle Automatic angle of the field of view ViewCenter Automatic point to display at the center ViewMatrix Automatic explicit transformation matrix ViewPoint {1.3,-2.4,2.} viewing position ViewProjection Automatic projection method for rendering objects distant from the viewer ViewRange All range of viewing distances to include ViewVector Automatic position and direction of a simulated camera ViewVertical {0,0,1} direction to make vertical WorkingPrecision MachinePrecision the precision used in internal computations
List of all options
Examples
open all close allBasic Examples (3)
Scope (24)
Data and Wrappers (8)
Tabular Data (1)
Bandwidth and Kernel (9)
Specify a single bandwidth for bivariate data:
Specify bivariate bandwidths in units of standard deviation:
Allow bivariate bandwidths to vary adaptively with local density:
Use the local sensitivity from 0.25 (small) to 0.75 (large):
Vary the initial bandwidth for an adaptive estimate:
Use initial bandwidths of 1. and 0.25:
Use any of several automatic bandwidth selection methods:
Silverman's method is used by default for bandwidth selection:
Use different bandwidth specifications in each dimension:
Presentation (6)
Provide an explicit PlotStyle for the surface:
Provide separate styles for different surfaces:
Options (77)
Axes (3)
AxesLabel (4)
AxesOrigin (2)
AxesStyle (3)
BoundaryStyle (4)
Use a black boundary around the edges of the surface:
Use a thick boundary around the edges of the surface:
BoundaryStyle applies to holes cut by RegionFunction:
BoxRatios (2)
ClippingStyle (4)
ColorFunction (6)
Color by scaled ![]() ,
, ![]() , and
, and ![]() values:
values:
Color according to the ![]() and
and ![]() coordinates:
coordinates:
Named color gradients from ColorData color in the ![]() direction:
direction:
ColorFunction has higher priority than PlotStyle:
ColorFunction has lower priority than MeshShading:
ColorFunctionScaling (2)
Filling (3)
Filling occurs along the region cut by the RegionFunction:
ImageSize (7)
Use named sizes such as Tiny, Small, Medium and Large:
Specify the width of the plot:
Specify the height of the plot:
Allow the width and height to be up to a certain size:
Specify the width and height for a graphic, padding with space if necessary:
Setting AspectRatioFull will fill the available space:
Use maximum sizes for the width and height:
Use ImageSizeFull to fill the available space in an object:
Specify the image size as a fraction of the available space:
Lighting (2)
Mesh (7)
SmoothHistogram3D typically has 10 mesh lines in the ![]() direction:
direction:
Use 5 mesh lines in the ![]() direction:
direction:
Show the complete sampling mesh:
Use 3 mesh lines in the ![]() direction and 6 mesh lines in the
direction and 6 mesh lines in the ![]() direction:
direction:
MeshFunctions (3)
SmoothHistogram3D uses a height mesh by default:
Use mesh lines in the ![]() and
and ![]() directions:
directions:
Use mesh lines corresponding to fixed distances from the mean:
MeshShading (4)
Use None to remove regions:
Lay a checkerboard pattern over a surface:
MeshShading has a higher priority than PlotStyle:
MeshShading has a higher priority than ColorFunction:
MeshStyle (2)
NormalsFunction (3)
Normals are automatically calculated:
Use None to get flat shading for all the polygons:
PlotPoints (2)
PlotRange (2)
SmoothHistogram3D automatically selects the domain:
Use the full domain generated by SmoothKernelDistribution:
PlotStyle (5)
Color a surface with diffuse blue:
Adjust Specularity for the surface:
Use Opacity to get transparent surfaces:
RegionFunction (4)
Clip small values of the surface:
Filling will fill from the region boundary:
Applications (3)
Determine the number of modes present in bivariate data. It is good practice to observe the density over a range of bandwidths:
Over several bandwidth choices, two modes are identified:
Compare the distribution of data to a parametric model:
Quantify the comparison with DistributionFitTest:
Smooth histogram for a multivariate slice of a random process:
Properties & Relations (7)
SmoothHistogram3D effectively plots the distribution function of SmoothKernelDistribution:
Use SmoothDensityHistogram and SmoothHistogram3D for bivariate data:
Use SmoothHistogram for univariate data:
Use Histogram3D and DensityHistogram to plot the data in discrete bins:
Use DiscretePlot3D to plot the data at discrete points:
Additional points will result in a better approximation of the underlying distribution:
As the bandwidth approaches infinity, the estimate approaches the shape of the kernel:
Text
Wolfram Research (2010), SmoothHistogram3D, Wolfram Language function, https://reference.wolfram.com/language/ref/SmoothHistogram3D.html (updated 2025).
CMS
Wolfram Language. 2010. "SmoothHistogram3D." Wolfram Language & System Documentation Center. Wolfram Research. Last Modified 2025. https://reference.wolfram.com/language/ref/SmoothHistogram3D.html.
APA
Wolfram Language. (2010). SmoothHistogram3D. Wolfram Language & System Documentation Center. Retrieved from https://reference.wolfram.com/language/ref/SmoothHistogram3D.html