


DensityHistogram
DensityHistogram[{{x1,y1},{x2,y2},…}]
plots a density histogram of the values {xi,yi}.
DensityHistogram[{{x1,y1},{x2,y2},…},bspec]
plots a density histogram with bins specified by bspec.
DensityHistogram[{{x1,y1},{x2,y2},…},bspec,hspec]
plots a density histogram with bin densities computed according to the specification hspec.
Details and Options
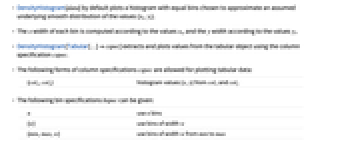
- DensityHistogram[data] by default plots a histogram with equal bins chosen to approximate an assumed underlying smooth distribution of the values {xi,yi}.
- The
 width of each bin is computed according to the values xi, and the
  width according to the values yi.
 - DensityHistogram[Tabular[…]cspec] extracts and plots values from the tabular object using the column specification cspec.
- The following forms of column specifications cspec are allowed for plotting tabular data:
-
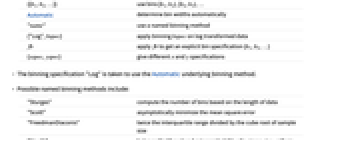
{colx,coly} histogram values {x,y} from colx and coly - The following bin specifications bspec can be given:
-
n use n bins {w} use bins of width w {min,max,w} use bins of width w from min to max {{b1,b2,…}} use bins [b1,b2),[b2,b3),… Automatic determine bin widths automatically "name" use a named binning method {"Log",bspec} apply binning bspec on log transformed data fb apply fb to get an explicit bin specification {b1,b2,…} {xspec,yspec} give different x and y specifications - The binning specification "Log" is taken to use the Automatic underlying binning method.
- Possible named binning methods include:
-
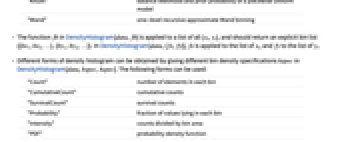
"Sturges" compute the number of bins based on the length of data "Scott" asymptotically minimize the mean square error "FreedmanDiaconis" twice the interquartile range divided by the cube root of sample size "Knuth" balance likelihood and prior probability of a piecewise uniform model "Wand" one-level recursive approximate Wand binning - The function fb in DensityHistogram[data,fb] is applied to a list of all {xi,yi}, and should return an explicit bin list {{bx1,bx2,…},{by1,by2,…}}. In DensityHistogram[data,{fx,fy}], fx is applied to the list of xi, and fy to the list of yi.
- Different forms of density histogram can be obtained by giving different bin density specifications hspec in DensityHistogram[data,bspec,hspec]. The following forms can be used:
-
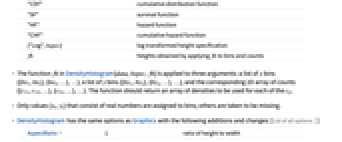
"Count" number of elements in each bin "CumulativeCount" cumulative counts "SurvivalCount" survival counts "Probability" fraction of values lying in each bin "Intensity" counts divided by bin area "PDF" probability density function "CDF" cumulative distribution function "SF" survival function "HF" hazard function "CHF" cumulative hazard function {"Log",hspec} log transformed height specification fh heights obtained by applying fh to bins and counts - The function fh in DensityHistogram[data,bspec,fh] is applied to three arguments: a list of
 bins {{bx1,bx2},{bx2,…},…}, a list of
  bins {{by1,by2},{by2,…},…}, and the corresponding 2D array of counts {{c11,c12,…},{c21,…},…}. The function should return an array of densities to be used for each of the cij.
 - Only values {xi,yi} that consist of real numbers are assigned to bins; others are taken to be missing.
- DensityHistogram has the same options as Graphics with the following additions and changes: [List of all options]
-
AspectRatio 1 ratio of height to width ChartBaseStyle Automatic overall style for tiles ChartElementFunction Automatic how to generate raw graphics for tiles ChartLegends None legends for data elements and datasets ClippingStyle None how to draw values clipped by PlotRange ColorFunction Automatic how to color the plot ColorFunctionScaling True whether to scale the argument to ColorFunction Frame True whether to draw a frame around the plot FrameTicks Automatic frame tick marks LabelingFunction Automatic how to label elements Method Automatic the method to use for refining the plot PerformanceGoal $PerformanceGoal aspects of performance to try to optimize PlotInteractivity $PlotInteractivity whether to allow interactive elements PlotRange Automatic the range of f or other values to include PlotRangeClipping True whether to clip at the plot range PlotRangePadding Automatic how much to pad the range of values PlotTheme $PlotTheme overall theme for the plot ScalingFunctions None how to scale individual coordinates - The arguments supplied to ChartElementFunction are the bin region {{xmin,xmax},{ymin,ymax}}, the bin values lists, and metadata {m1,m2,…}.
- The argument supplied to ColorFunction is the density for each bin.
- With ScalingFunctions->{sx,sy,sz}, the
 coordinate is scaled using sx etc.
 - Style and other options are effectively applied in the order ChartBaseStyle, ColorFunction, and ChartElementFunction, with later specifications overriding earlier ones.
-
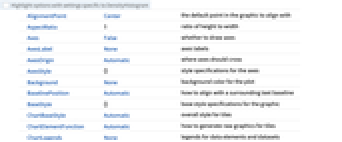
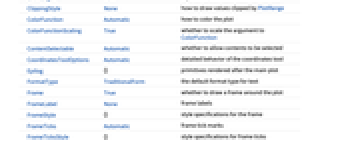
 Highlight options with settings specific to DensityHistogram
-
AlignmentPoint Center the default point in the graphic to align with AspectRatio 1 ratio of height to width Axes False whether to draw axes AxesLabel None axes labels AxesOrigin Automatic where axes should cross AxesStyle {} style specifications for the axes Background None background color for the plot BaselinePosition Automatic how to align with a surrounding text baseline BaseStyle {} base style specifications for the graphic ChartBaseStyle Automatic overall style for tiles ChartElementFunction Automatic how to generate raw graphics for tiles ChartLegends None legends for data elements and datasets ClippingStyle None how to draw values clipped by PlotRange ColorFunction Automatic how to color the plot ColorFunctionScaling True whether to scale the argument to ColorFunction ContentSelectable Automatic whether to allow contents to be selected CoordinatesToolOptions Automatic detailed behavior of the coordinates tool Epilog {} primitives rendered after the main plot FormatType TraditionalForm the default format type for text Frame True whether to draw a frame around the plot FrameLabel None frame labels FrameStyle {} style specifications for the frame FrameTicks Automatic frame tick marks FrameTicksStyle {} style specifications for frame ticks GridLines None grid lines to draw GridLinesStyle {} style specifications for grid lines ImageMargins 0. the margins to leave around the graphic ImagePadding All what extra padding to allow for labels etc. ImageSize Automatic the absolute size at which to render the graphic LabelingFunction Automatic how to label elements LabelStyle {} style specifications for labels Method Automatic the method to use for refining the plot PerformanceGoal $PerformanceGoal aspects of performance to try to optimize PlotInteractivity $PlotInteractivity whether to allow interactive elements PlotLabel None an overall label for the plot PlotRange Automatic the range of f or other values to include PlotRangeClipping True whether to clip at the plot range PlotRangePadding Automatic how much to pad the range of values PlotRegion Automatic the final display region to be filled PlotTheme $PlotTheme overall theme for the plot PreserveImageOptions Automatic whether to preserve image options when displaying new versions of the same graphic Prolog {} primitives rendered before the main plot RotateLabel True whether to rotate y labels on the frame ScalingFunctions None how to scale individual coordinates Ticks Automatic axes ticks TicksStyle {} style specifications for axes ticks
List of all options
Examples
open all close allBasic Examples (3)
Scope (13)
Data (8)
Specify the number of bins to use:
Specify a different number of bins to use in x and y:
Specify a different bin width to use in x and y:
Specify different bin delimiters to use in x and y:
Specify bin delimiters as an explicit list:
Specify different bin delimiters to use in x and y:
Use different automatic binning methods:
Use different height specifications:
Use a height function that accumulates the bin counts over the y direction:
Tabular Data (1)
Options (55)
AspectRatio (4)
By default, DensityHistogram uses the same width and height:
Specify the height to width ratio:
Use Automatic to determine the ratio from the values:
AspectRatioFull adjusts the height and width to tightly fit inside other constructs:
Axes (3)
By default, DensityHistogram uses a frame instead of axes:
AxesLabel (4)
AxesOrigin (2)
AxesStyle (4)
ChartBaseStyle (3)
Use ChartBaseStyle to style bins:
ChartBaseStyle combines with ColorFunction:
ColorFunction may override settings for ChartBaseStyle:
ChartElementFunction (3)
Get a list of built-in settings for ChartElementFunction:
For detailed settings, use Palettes ▶ ChartElementSchemes:
Write a custom ChartElementFunction:
ColorFunction (5)
Named color gradients color in the ![]() direction:
direction:
Use brightness to correspond to height or density of a function:
Use ColorFunctionScaling->False to get unscaled height values:
Use ColorFunction to combine different style effects:
ColorFunctionScaling (2)
By default, scaled height values are used:
Use ColorFunctionScaling->False to get unscaled height values:
ImageSize (7)
Use named sizes such as Tiny, Small, Medium and Large:
Specify the width of the plot:
Specify the height of the plot:
Allow the width and height to be up to a certain size:
Specify the width and height for a graphic, padding with space if necessary:
Setting AspectRatioFull will fill the available space:
Use maximum sizes for the width and height:
Use ImageSizeFull to fill the available space in an object:
Specify the image size as a fraction of the available space:
LabelingFunction (3)
Use automatic labeling by values through Tooltip and StatusArea:
Use Placed to control label placement:
Method (2)
PerformanceGoal (1)
PlotInteractivity (2)
Ticks (4)
Applications (3)
Estimate the density of volcanic craters in western Uganda:
A scaling function for labeling:
The estimated density with a scaled legend:
Density histogram for a multivariate time slice of a random process:
Analyze TemporalData by plotting a density histogram for two-dimensional time slices:
Properties & Relations (4)
DensityHistogram automatically determines bins to use based on data:
DensityHistogram colors the height according to ColorFunction:
Use Histogram3D to visualize data in 3D:
Use SmoothDensityHistogram and SmoothHistogram3D to compare estimated distribution with the data:
Neat Examples (1)
Text
Wolfram Research (2010), DensityHistogram, Wolfram Language function, https://reference.wolfram.com/language/ref/DensityHistogram.html (updated 2025).
CMS
Wolfram Language. 2010. "DensityHistogram." Wolfram Language & System Documentation Center. Wolfram Research. Last Modified 2025. https://reference.wolfram.com/language/ref/DensityHistogram.html.
APA
Wolfram Language. (2010). DensityHistogram. Wolfram Language & System Documentation Center. Retrieved from https://reference.wolfram.com/language/ref/DensityHistogram.html