


GeoSmoothHistogram
GeoSmoothHistogram[locs]
plots a smooth kernel histogram of the geo locations locs.
GeoSmoothHistogram[locs,espec]
plots a smooth kernel histogram with estimator specification espec.
GeoSmoothHistogram[locs,espec,dfun]
plots the distribution function dfun.
Details and Options
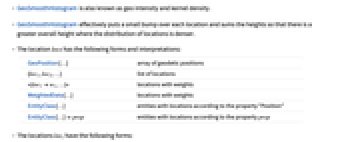
- GeoSmoothHistogram is also known as geo intensity and kernel density.
- GeoSmoothHistogram effectively puts a small bump over each location and sums the heights so that there is a greater overall height where the distribution of locations is denser.
- The location locs has the following forms and interpretations:
-
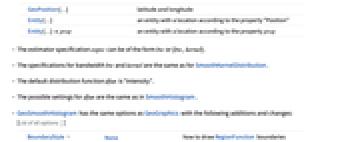
GeoPosition[…] array of geodetic positions {loc1,loc2,…} list of locations <loc1w1,…> locations with weights WeightedData[…] locations with weights EntityClass[…] entities with locations according to the property "Position" EntityClass[…]prop entities with locations according to the property prop - The locations loci have the following forms:
-
GeoPosition[…] latitude and longitude Entity[…] an entity with a location according to the property "Position" Entity[…]prop an entity with a location according to the property prop - The estimator specification espec can be of the form bw or {bw,kernel}.
- The specifications for bandwidth bw and kernel are the same as for SmoothKernelDistribution.
- The default distribution function dfun is "Intensity".
- The possible settings for dfun are the same as in SmoothHistogram.
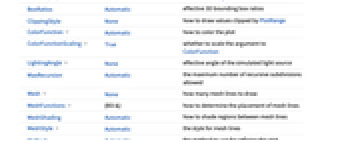
- GeoSmoothHistogram has the same options as GeoGraphics with the following additions and changes: [List of all options]
-
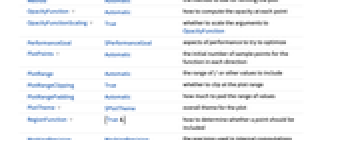
BoundaryStyle None how to draw RegionFunction boundaries BoxRatios Automatic effective 3D bounding box ratios ClippingStyle None how to draw values clipped by PlotRange ColorFunction Automatic how to color the plot ColorFunctionScaling True whether to scale the argument to ColorFunction LightingAngle None effective angle of the simulated light source MaxRecursion Automatic the maximum number of recursive subdivisions allowed Mesh None how many mesh lines to draw MeshFunctions {#3&} how to determine the placement of mesh lines MeshShading Automatic how to shade regions between mesh lines MeshStyle Automatic the style for mesh lines Method Automatic the method to use for refining the plot OpacityFunction Automatic how to compute the opacity at each point OpacityFunctionScaling True whether to scale the arguments to OpacityFunction PerformanceGoal $PerformanceGoal aspects of performance to try to optimize PlotPoints Automatic the initial number of sample points for the function in each direction PlotRange Automatic the range of f or other values to include PlotRangeClipping True whether to clip at the plot range PlotRangePadding Automatic how much to pad the range of values PlotTheme $PlotTheme overall theme for the plot RegionFunction (True&) how to determine whether a point should be included WorkingPrecision MachinePrecision the precision used in internal computations - ColorFunction and OpacityFunction are supplied with a single argument, given by default by the scaled value of the intensity f.
- Typical settings for OpacityFunction include:
-
Automatic automatically determined None no opacity function, fully opaque α constant opacity Opacity[α] Interval[…] make values in the interval more opaque func general opacity function - The arguments supplied to RegionFunction are x, y and f, where f is the intensity.
- The value of region in RegionFunctionregion can be an entity or geo polygon over which to plot.
- With the setting MeshShadingAutomatic, the colors between mesh lines are computed from the ColorFunction setting.
-
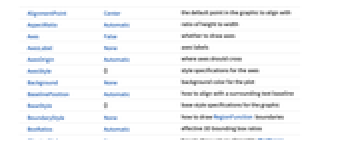
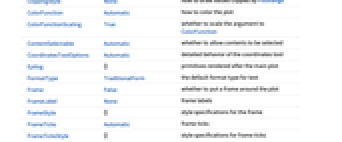
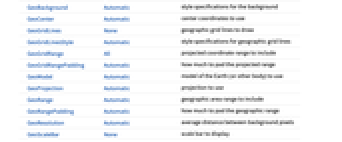
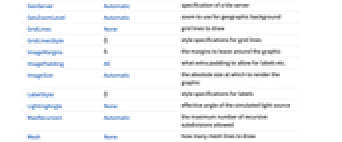
AlignmentPoint Center the default point in the graphic to align with AspectRatio Automatic ratio of height to width Axes False whether to draw axes AxesLabel None axes labels AxesOrigin Automatic where axes should cross AxesStyle {} style specifications for the axes Background None background color for the plot BaselinePosition Automatic how to align with a surrounding text baseline BaseStyle {} base style specifications for the graphic BoundaryStyle None how to draw RegionFunction boundaries BoxRatios Automatic effective 3D bounding box ratios ClippingStyle None how to draw values clipped by PlotRange ColorFunction Automatic how to color the plot ColorFunctionScaling True whether to scale the argument to ColorFunction ContentSelectable Automatic whether to allow contents to be selected CoordinatesToolOptions Automatic detailed behavior of the coordinates tool Epilog {} primitives rendered after the main plot FormatType TraditionalForm the default format type for text Frame False whether to put a frame around the plot FrameLabel None frame labels FrameStyle {} style specifications for the frame FrameTicks Automatic frame ticks FrameTicksStyle {} style specifications for frame ticks GeoBackground Automatic style specifications for the background GeoCenter Automatic center coordinates to use GeoGridLines None geographic grid lines to draw GeoGridLinesStyle Automatic style specifications for geographic grid lines GeoGridRange All projected coordinate range to include GeoGridRangePadding Automatic how much to pad the projected range GeoModel Automatic model of the Earth (or other body) to use GeoProjection Automatic projection to use GeoRange Automatic geographic area range to include GeoRangePadding Automatic how much to pad the geographic range GeoResolution Automatic average distance between background pixels GeoScaleBar None scale bar to display GeoServer Automatic specification of a tile server GeoZoomLevel Automatic zoom to use for geographic background GridLines None grid lines to draw GridLinesStyle {} style specifications for grid lines ImageMargins 0. the margins to leave around the graphic ImagePadding All what extra padding to allow for labels etc. ImageSize Automatic the absolute size at which to render the graphic LabelStyle {} style specifications for labels LightingAngle None effective angle of the simulated light source MaxRecursion Automatic the maximum number of recursive subdivisions allowed Mesh None how many mesh lines to draw MeshFunctions {#3&} how to determine the placement of mesh lines MeshShading Automatic how to shade regions between mesh lines MeshStyle Automatic the style for mesh lines MetaInformation {} meta-information about the map Method Automatic the method to use for refining the plot OpacityFunction Automatic how to compute the opacity at each point OpacityFunctionScaling True whether to scale the arguments to OpacityFunction PerformanceGoal $PerformanceGoal aspects of performance to try to optimize PlotLabel None an overall label for the plot PlotPoints Automatic the initial number of sample points for the function in each direction PlotRange Automatic the range of f or other values to include PlotRangeClipping True whether to clip at the plot range PlotRangePadding Automatic how much to pad the range of values PlotRegion Automatic the final display region to be filled PlotTheme $PlotTheme overall theme for the plot PreserveImageOptions Automatic whether to preserve image options when displaying new versions of the same graphic Prolog {} primitives rendered before the main plot RasterSize Automatic raster dimensions for the background data RegionFunction (True&) how to determine whether a point should be included RotateLabel True whether to rotate y labels on the frame Ticks Automatic axes ticks TicksStyle {} style specifications for axes ticks WorkingPrecision MachinePrecision the precision used in internal computations
List of all options

Examples
open all close allBasic Examples (2)
Scope (23)
Data (11)
Use a GeoPosition representing a list of locations:
Use a list of GeoPosition locations:
Use entities to represent locations:
Create an intensity plot from the EntityClass containing skyscrapers around the world:
Use an Association with locations for keys and values for counts:
Use WeightedData:
GeoRange is selected automatically:
Use GeoRange to focus on geographic areas of interest:
Nonreal data points are ignored:
Specify the number of points to use:
Bandwidth and Kernel (7)
Specify a single bandwidth for bivariate data:
Allow bivariate bandwidths to vary adaptively with local density:
Use the local sensitivity from ![]() (small) to
(small) to ![]() (large):
(large):
Use any of several automatic bandwidth selection methods:
Silverman's method is used by default for bandwidth selection:
Use different bandwidth specifications in each dimension:
Options (57)
AspectRatio (4)
By default, the ratio of the height to width for the plot is determined automatically:
Make the height the same as the width with AspectRatio1:
Use numerical value to specify the height-to-width ratio:
AspectRatioFull adjusts the height and width to tightly fit inside other constructs:
Axes (3)
AxesOrigin (2)
AxesStyle (4)
BoundaryStyle (2)
Use a red boundary around the edges of the surface:
BoundaryStyle applies to regions cut by RegionFunction:
ColorFunction (4)
By default, regions with a lower density of points are colored lighter:
Specify the color function from a coloring scheme:
Specify a specific color function:
Use ColorFunctionScalingFalse to get unscaled height values:
ColorFunctionScaling (1)
Use ColorFunctionScalingFalse to get unscaled height values:
Frame (4)
GeoSmoothHistogram does not use a frame by default:
Use FrameTrue to draw a frame around the plot:
FrameLabel (4)
GeoBackground (3)
GeoCenter (1)
GeoGridLines (1)
Overlay a map with geo grid lines using the default styling:
Draw geo grid lines at specific lines of latitude and longitude:
Draw geo grid lines at specific lines of latitude:
Draw geo grid lines at specific lines of longitude:
Specify the target number of geo grid lines:
Specify different numbers of latitude and longitude geo grid lines:
GeoProjection (1)
Use GeoProjection to change the map projection:
GeoRange (1)
GeoRangePadding (1)
Use GeoRangePaddingNone to remove padding:
Use 250 kilometers of padding on each side of the map:
Specify padding for latitude only:
GeoScaleBar (1)
GeoServer (1)
GeoZoomLevel (1)
Explicitly specify GeoZoomLevel to obtain a lower-resolution map rendering:
Explicitly specify GeoZoomLevel to obtain a higher-resolution map rendering:
LightingAngle (1)
Mesh (1)
GeoSmoothHistogram does not show a mesh by default:
Use 5 mesh lines in the ![]() direction:
direction:
Use 3 mesh lines in the ![]() direction and 6 mesh lines in the
direction and 6 mesh lines in the ![]() direction:
direction:
MeshFunctions (1)
OpacityFunction (1)
PlotLegends (1)
PlotTheme (1)
Applications (4)
Properties & Relations (9)
Use SmoothDensityHistogram and SmoothHistogram3D for general data:
Use GeoListPlot for individual locations:
Use GeoBubbleChart to show values with scaled bubbles:
Use GeoRegionValuePlot to show values with colored regions:
Use GeoHistogram to aggregate locations into bins:
Use GeoVectorPlot and GeoStreamPlot for vector fields:
Draw contours on a map with GeoContourPlot:
Smoothly shade a map using color with GeoDensityPlot:
Text
Wolfram Research (2018), GeoSmoothHistogram, Wolfram Language function, https://reference.wolfram.com/language/ref/GeoSmoothHistogram.html (updated 2019).
CMS
Wolfram Language. 2018. "GeoSmoothHistogram." Wolfram Language & System Documentation Center. Wolfram Research. Last Modified 2019. https://reference.wolfram.com/language/ref/GeoSmoothHistogram.html.
APA
Wolfram Language. (2018). GeoSmoothHistogram. Wolfram Language & System Documentation Center. Retrieved from https://reference.wolfram.com/language/ref/GeoSmoothHistogram.html