


GeoVectorPlot
GeoVectorPlot[vecs]
generates a vector plot from the field of geo vectors vecs.
GeoVectorPlot[{vecs1,vecs2,…}]
generates a separate set of vectors for each vecsi.
Details and Options
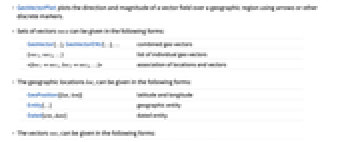
- GeoVectorPlot plots the direction and magnitude of a vector field over a geographic region using arrows or other discrete markers.
- Sets of vectors vecs can be given in the following forms:
-
GeoVector[…],GeoVectorENU[…],… combined geo vectors {vec1,vec2,…} list of individual geo vectors <loc1vec1,loc2vec2,…> association of locations and vectors - The geographic locations loci can be given in the following forms:
-
GeoPosition[{lat,lon}] latitude and longitude Entity[…] geographic entity Dated[ent,date] dated entity - The vectors veci can be given in the following forms:
-
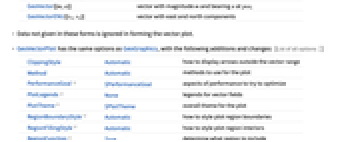
GeoVector[{m,α}] vector with magnitude m and bearing α at posi GeoVectorENU[{ve,vn}] vector with east and north components - Data not given in these forms is ignored in forming the vector plot.
- GeoVectorPlot has the same options as GeoGraphics, with the following additions and changes: [List of all options]
-
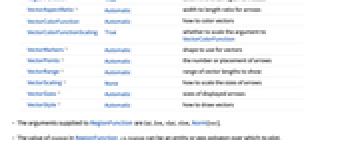
ClippingStyle Automatic how to display arrows outside the vector range Method Automatic methods to use for the plot PerformanceGoal $PerformanceGoal aspects of performance to try to optimize PlotLegends None legends for vector fields PlotTheme $PlotTheme overall theme for the plot RegionBoundaryStyle Automatic how to style plot region boundaries RegionFillingStyle Automatic how to style plot region interiors RegionFunction True determine what region to include VectorAspectRatio Automatic width to length ratio for arrows VectorColorFunction Automatic how to color vectors VectorColorFunctionScaling True whether to scale the argument to VectorColorFunction VectorMarkers Automatic shape to use for vectors VectorPoints Automatic the number or placement of arrows VectorRange Automatic range of vector lengths to show VectorScaling None how to scale the sizes of arrows VectorSizes Automatic sizes of displayed arrows VectorStyle Automatic how to draw vectors - The arguments supplied to RegionFunction are lat, lon, vlat, vlon, Norm[vec].
- The value of region in RegionFunction->region can be an entity or geo polygon over which to plot.
- VectorPoints and StreamPoints accept collections of geo positions and entities.
-
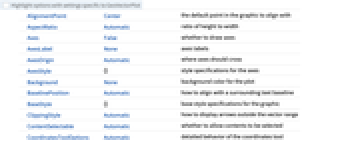
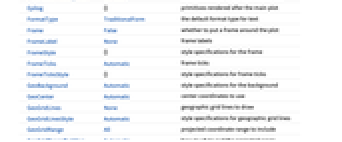
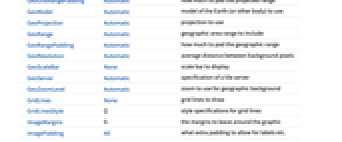
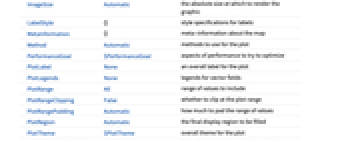
AlignmentPoint Center the default point in the graphic to align with AspectRatio Automatic ratio of height to width Axes False whether to draw axes AxesLabel None axes labels AxesOrigin Automatic where axes should cross AxesStyle {} style specifications for the axes Background None background color for the plot BaselinePosition Automatic how to align with a surrounding text baseline BaseStyle {} base style specifications for the graphic ClippingStyle Automatic how to display arrows outside the vector range ContentSelectable Automatic whether to allow contents to be selected CoordinatesToolOptions Automatic detailed behavior of the coordinates tool Epilog {} primitives rendered after the main plot FormatType TraditionalForm the default format type for text Frame False whether to put a frame around the plot FrameLabel None frame labels FrameStyle {} style specifications for the frame FrameTicks Automatic frame ticks FrameTicksStyle {} style specifications for frame ticks GeoBackground Automatic style specifications for the background GeoCenter Automatic center coordinates to use GeoGridLines None geographic grid lines to draw GeoGridLinesStyle Automatic style specifications for geographic grid lines GeoGridRange All projected coordinate range to include GeoGridRangePadding Automatic how much to pad the projected range GeoModel Automatic model of the Earth (or other body) to use GeoProjection Automatic projection to use GeoRange Automatic geographic area range to include GeoRangePadding Automatic how much to pad the geographic range GeoResolution Automatic average distance between background pixels GeoScaleBar None scale bar to display GeoServer Automatic specification of a tile server GeoZoomLevel Automatic zoom to use for geographic background GridLines None grid lines to draw GridLinesStyle {} style specifications for grid lines ImageMargins 0. the margins to leave around the graphic ImagePadding All what extra padding to allow for labels etc. ImageSize Automatic the absolute size at which to render the graphic LabelStyle {} style specifications for labels MetaInformation {} meta-information about the map Method Automatic methods to use for the plot PerformanceGoal $PerformanceGoal aspects of performance to try to optimize PlotLabel None an overall label for the plot PlotLegends None legends for vector fields PlotRange All range of values to include PlotRangeClipping False whether to clip at the plot range PlotRangePadding Automatic how much to pad the range of values PlotRegion Automatic the final display region to be filled PlotTheme $PlotTheme overall theme for the plot PreserveImageOptions Automatic whether to preserve image options when displaying new versions of the same graphic Prolog {} primitives rendered before the main plot RasterSize Automatic raster dimensions for the background data RegionBoundaryStyle Automatic how to style plot region boundaries RegionFillingStyle Automatic how to style plot region interiors RegionFunction True determine what region to include RotateLabel True whether to rotate y labels on the frame Ticks Automatic axes ticks TicksStyle {} style specifications for axes ticks VectorAspectRatio Automatic width to length ratio for arrows VectorColorFunction Automatic how to color vectors VectorColorFunctionScaling True whether to scale the argument to VectorColorFunction VectorMarkers Automatic shape to use for vectors VectorPoints Automatic the number or placement of arrows VectorRange Automatic range of vector lengths to show VectorScaling None how to scale the sizes of arrows VectorSizes Automatic sizes of displayed arrows VectorStyle Automatic how to draw vectors
List of all options
Examples
open all close allBasic Examples (3)
Scope (20)
Data (11)
Plot vectors for a collection of vectors and give a geographical range for the domain:
Show all of the specified field vectors:
Use GeoVector to represent a collection of vectors with modulus m and bearing α:
Use GeoVector to represent a list of individual vectors with modulus m and bearing α at corresponding locations:
Use GeoVectorENU to represent a collection of vectors:
Use QuantityArray to represent an array of quantity vectors:
Plot an irregular collection of vectors:
Show all of the specified field vectors:
Explicitly set the number of vectors in each direction:
Plot a vector field with vectors placed with specified densities:
Presentation (9)
Use a specific color for the arrows:
Plot a vector field map with arrows of specified size:
Vary the arrow length and arrowhead size:
Plot a vector field map with arrows colored according to the magnitude of the field:
Use a named appearance to draw the vectors on the map:
Show the vectors over a satellite map:
Use the Albers GeoProjection centered on Champaign, IL:
Add grid lines and a scale bar:
Options (69)
AspectRatio (4)
By default, the ratio of the height to width for the plot is determined automatically:
Make the height the same as the width with AspectRatio1:
Use numerical value to specify the height-to-width ratio:
AspectRatioFull adjusts the height and width to tightly fit inside other constructs:
Axes (3)
AxesStyle (4)
Frame (4)
GeoVectorPlot does not use a frame by default:
Use FrameTrue to draw a frame around the plot:
FrameLabel (4)
GeoCenter (3)
By default, the world map is located at {0,0} coordinates:
Center the vectors over the map on Champaign, IL:
Use a different GeoProjection:
GeoGridLines (1)
Use GeoGridLines to overlay the map with lines of latitude and longitude:
Draw GeoGridLines at specific lines of latitude and longitude:
GeoProjection (1)
GeoRange (1)
Use GeoRange to define the latitude and longitude coordinate ranges:
GeoRangePadding (1)
By default, no padding is added to the vector map:
Use GeoRangePadding to pad the coordinate range for the map:
Use GeoRangePadding to pad the coordinate range for the map:
GeoScaleBar (1)
GeoServer (1)
By default, GeoVectorPlot downloads geo background tiles from the Wolfram GeoServer:
GeoZoomLevel (1)
Display wind directions over a map of New York City at the default GeoZoomLevel:
Display the vector map at different levels of magnification:
RegionBoundaryStyle (3)
RegionFillingStyle (3)
RegionFunction (2)
VectorMarkers (6)
VectorPoints (7)
Use automatically determined vector points:
Show all of the specified field vectors:
Use symbolic names to specify the set of field vectors:
Create a regular grid of field vectors with the same number of arrows for ![]() and
and ![]() :
:
Create a regular grid of field vectors with a different number of arrows for ![]() and
and ![]() :
:
VectorSizes (2)
VectorStyle (3)
VectorColorFunction has precedence over colors in VectorStyle:
Use VectorColorFunctionNone to specify colors with VectorStyle:
Properties & Relations (13)
GeoStreamPlot shows the vector field with continuous streamlines:
Use GeoBubbleChart to show values with scaled bubbles:
Use GeoRegionValuePlot to show values with colored regions:
Use GeoHistogram to aggregate locations into bins:
Use GeoSmoothHistogram to generate smooth densities from locations
Use GeoListPlot for individual locations:
Draw contours on a map with GeoContourPlot:
Smoothly shade a map using color with GeoDensityPlot:
Plot relationships between geographic locations on a map:
Use ListVectorPlot or ListStreamPlot for general data:
Use ListVectorDensityPlot or ListStreamDensityPlot to include a density plot of a scalar field:
Use VectorDisplacementPlot to visualize the effect of a displacement field:
Use ListVectorPlot3D and ListStreamPlot3D to visualize 3D vector field data:
Text
Wolfram Research (2019), GeoVectorPlot, Wolfram Language function, https://reference.wolfram.com/language/ref/GeoVectorPlot.html (updated 2020).
CMS
Wolfram Language. 2019. "GeoVectorPlot." Wolfram Language & System Documentation Center. Wolfram Research. Last Modified 2020. https://reference.wolfram.com/language/ref/GeoVectorPlot.html.
APA
Wolfram Language. (2019). GeoVectorPlot. Wolfram Language & System Documentation Center. Retrieved from https://reference.wolfram.com/language/ref/GeoVectorPlot.html