Vector Visualization
The Wolfram Language provides state-of-the-art fully automated visualization of vector functions and data—suitable for representing flows, field lines, and other vector fields of any complexity.
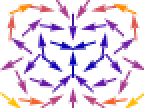
Vector Plots
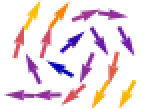 VectorPlot, ListVectorPlot — plot vectors from a vector field
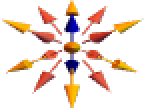 VectorPlot3D, ListVectorPlot3D — plot vectors from a 3D vector field
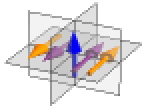 SliceVectorPlot3D, ListSliceVectorPlot3D — plot vectors on a slice surface
Stream Plots
 StreamPlot, ListStreamPlot — make a stream plot from a vector field
 StreamPlot3D, ListStreamPlot3D — make a stream plot from a 3D vector field
Displacement Plots
 VectorDisplacementPlot, ListVectorDisplacementPlot — vector fields displacing objects
 VectorDisplacementPlot3D, ListVectorDisplacementPlot3D — vector fields displacing 3D objects
Combination Plots
 VectorDensityPlot, ListVectorDensityPlot — vector plot with density background
 StreamDensityPlot, ListStreamDensityPlot — stream plot with density background
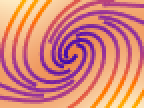
Convolution Plots
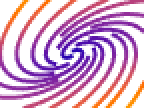
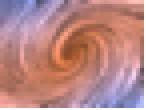 LineIntegralConvolutionPlot, ListLineIntegralConvolutionPlot — vector fields transforming an image
Geographic Visualization »
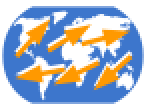 GeoVectorPlot ▪
  GeoStreamPlot ▪ ...
Complex Visualization »
 ComplexVectorPlot ▪
  ComplexStreamPlot ▪ ...
Options
StreamPoints, VectorPoints — number or placement of streamlines, vectors
StreamScale — scale and size of streamlines
VectorScaling, VectorSizes — scale and size of vectors
StreamStyle, VectorStyle — color and style of streamlines, vectors
StreamMarkers, VectorMarkers — general shape of streamlines, vectors
ColorFunction, Mesh, MeshFunctions — coloring, meshing, contouring, etc. for scalars