

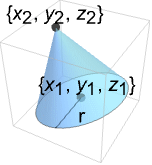


Cone
范例
打开所有单元 关闭所有单元基本范例 (4)
Graphics3D[Cone[]]Graphics3D[Cone[{{0, 0, 0}, {1, 1, 1}}, 1 / 2]]{Graphics3D[{Yellow, Cone[]}], Graphics3D[{EdgeForm[Thick], Cone[]}], Graphics3D[{EdgeForm[Dashed], Cone[]}], Graphics3D[{EdgeForm[Directive[Thick, Dashed, Blue]], Orange, Cone[]}]}Volume[Cone[{{Subscript[x, 1], Subscript[y, 1], Subscript[z, 1]}, {Subscript[x, 2], Subscript[y, 2], Subscript[z, 2]}}, r]]RegionCentroid[Cone[{{Subscript[x, 1], Subscript[y, 1], Subscript[z, 1]}, {Subscript[x, 2], Subscript[y, 2], Subscript[z, 2]}}, r]]范围 (22)
图形 (12)
规范 (5)
Graphics3D[Cone[{{0, 0, 0}, {0, 0, 1}}]]Graphics3D[{Cone[{{0, 0, 3}, {0, 0, -3}}, 1], Cone[{{5, 0, 3}, {5, 0, -3}}, 3]}]Graphics3D[{Cone[{{0, 0, 0}, {1, 0, 0}}], Cone[{{1, 1, 1}, {2, 3, 1}}]}]Graphics3D[Cone[], Axes -> True]s = {{0, 0, 0}, {0, 0, 2}};Graphics3D[Cone[{s, s + 2}]]样式化 (5)
Table[Graphics3D[{c, Cone[]}], {c, {Red, Green, Blue, Yellow}}]FaceForm 和 EdgeForm 可用于指定表面和边的样式:
Graphics3D[{FaceForm[Pink], EdgeForm[Directive[Dashed, Thick, Blue]], Cone[]}]使用 FaceForm 可以指定前面和后面的不同属性:
Graphics3D[{FaceForm[Yellow, Blue], Cone[]}, PlotRange -> {{-1, 1}, {-.2, 1}, {-1, 1}}]Table[Graphics3D[{Orange, Specularity[White, n], Cone[]}, Lighting -> {{"Point", White, Scaled[{2, -1, 1.2}]}}], {n, {5, 20, 100}}]Graphics3D[{Glow[Red], Black, Cone[]}]Opacity 指定表面不透明度:
Table[Graphics3D[{Opacity[o], Cone[]}], {o, {0.3, 0.5, 0.9}}]区域 (10)
ℛ = Cone[{{0, 0, 0}, {1, 1, 1}}, 2];RegionEmbeddingDimension[ℛ]RegionDimension[ℛ]ℛ = Cone[{{0, 0, 0}, {1, 1, 1}}, 2];{RegionMember[ℛ, {(1/3), (1/3), (1/3)}], RegionMember[ℛ, {5, 5, 5}]}RegionMember[ℛ, {x, y, z}]ℛ = Cone[{{0, 0, 0}, {1, 1, 1}}, 2];{Volume[ℛ], RegionMeasure[ℛ]}c = RegionCentroid[ℛ]Graphics3D[{{Opacity[0.5], LightBlue, ℛ}, {PointSize[Large], Red, Point[c]}}]ℛ = Cone[{{0, 0, 0}, {1, 1, 1}}, 2];{RegionDistance[ℛ, {1, 2, 3}], RegionDistance[ℛ, {(1/3), (1/4), (1/5)}]}ContourPlot3D[Evaluate@RegionDistance[ℛ, {x, y, z}], {x, -3, 3}, {y, -3, 2.5}, {z, -2.5, 3}, Mesh -> None, Contours -> {0.25, 0.5, 1}, ContourStyle -> ColorData[94, "ColorList"], Lighting -> "Neutral", BaseStyle -> Opacity[0.5], BoxRatios -> Automatic]ℛ = Cone[{{0, 0, 0}, {1, 1, 1}}, 2];{SignedRegionDistance[ℛ, {1, 2, 3}], SignedRegionDistance[ℛ, {(1/3), (1/4), (1/5)}]}ℛ = Cone[{{0, 0, 0}, {1, 1, 1}}, 2];{RegionNearest[ℛ, {1, 2, 3}], RegionNearest[ℛ, {(1/3), (1/4), (1/5)}]}spherePoints[{n_, m_}, c_, r_] :=
Flatten[Table[c + r{Cos[k 2π / n]Sin[l π / m], Sin[k 2π / n]Sin[l π / m], Cos[l π / m]}, {k, 0., n - 1}, {l, 0., m - 1}], 1];pl = spherePoints[{16, 8}, RegionCentroid[ℛ], 3];
npl = Table[RegionNearest[ℛ, p], {p, pl}];Legended[Graphics3D[{ℛ, {Thin, Gray, Line[Transpose[{pl, npl}]]}, {Red, Point[pl]}, {PointSize[Medium], Blue, Point[npl]}}, Lighting -> "Neutral", Boxed -> False], PointLegend[{Red, Blue}, {"start", "nearest"}]]ℛ = Cone[{{0, 0, 0}, {1, 1, 1}}, 1];BoundedRegionQ[ℛ]r = RegionBounds[ℛ]Graphics3D[{{EdgeForm[White], Opacity[0.2, Yellow], Cuboid@@Transpose[r]}, ℛ}, Boxed -> False]ℛ = Cone[{{0, 0, 0}, {1, 1, 1}}, 2];Integrate[x + y + z, {x, y, z}∈ℛ]ℛ = Cone[{{0, 0, 0}, {1, 1, 1}}, 2];MinValue[{x y z - x y, {x, y, z}∈ℛ}, {x, y, z}]ℛ = Cone[{{0, 0, 0}, {1, 1, 1}}, 2];Reduce[x^2 + y^2 + z^2 == 1 && x - y - z == -1 && z^2 == x y && {x, y, z}∈ℛ, {x, y, z}]应用 (5)
ℛ = Cone[{{0, 0, 0}, {0, 0, h}}, r];Minimize[{Area[RegionBoundary[ℛ]], Volume[ℛ] == π / 3 && r > 0 && h > 0}, {r, h}, Reals]Graphics3D[#, PlotLabel -> Area[RegionBoundary[#]]]& /@ Diagonal@Table[ℛ, {r, {1 / (4Sqrt[2]), 1 / Sqrt[2], 2 / Sqrt[2]}}, {h, {8, 2, 1 / 2}}]Subscript[ℛ, 1] = Cone[{{0, 0, 0}, {0, 0, 2}}, 2];
Subscript[ℛ, 2] = InfinitePlane[{0, 0, 0}, {{1, 1, 1}, {0, 1, 1}}];i = RegionIntersection[Subscript[ℛ, 1], Subscript[ℛ, 2]]//DiscretizeRegiong = Graphics3D[{{Opacity[0.3], Darker@Green, Subscript[ℛ, 1]}, {Opacity[0.5], LightRed, Subscript[ℛ, 2]}}, Boxed -> False, Lighting -> "Neutral"];Show[g, i]data = RandomReal[{1, 10}, {12, 4}];Graphics3D[MapIndexed[{Hue[(Last[#2] - 1) / 4], Cylinder[{Append[{1, 2}#2, 0], Append[{1, 2}#2, #1]}, .4], Cone[{Append[{1, 2}#2, #1], Append[{1, 2}#2, #1 + 2]}, .6]}&, data, {2}], Axes -> {False, False, True}, Lighting -> "Neutral"]定义基于 Cone 的一个 ChartElementFunction:
ConeBar[{{xmin_, xmax_}, {ymin_, ymax_}, {zmin_, zmax_}}, ___] :=
Cone[{{(xmin + xmax) / 2, (ymin + ymax) / 2, zmin}, {(xmin + xmax) / 2, (ymin + ymax) / 2, zmax}}, Min[(xmax - xmin) / 2, (ymax - ymin) / 2]]data = RandomReal[1, {2, 5}];BarChart3D[data, ChartElementFunction -> ConeBar]BarChart3D 用 Cone 产生三维条形图:
BarChart3D[data, ChartElementFunction -> "Cone"]Histogram3D 可以类似地使用 Cone:
Histogram3D[RandomReal[NormalDistribution[0, 1], {500, 2}], 10, ChartElementFunction -> "Cone"]用 Cone 显示 BubbleChart3D 中的气泡:
BubbleChart3D[RandomReal[1, {3, 10, 4}], ChartElements -> Graphics3D[Cone[]]]属性和关系 (6)
用 Scale 获得椭圆圆锥:
Graphics3D[Scale[Cone[], {2, 4, 3}, {0, 0, 0}], Axes -> True]Graphics3D[{Arrowheads[.4], Blue, Arrow[Tube[{{0, 0, 0}, {2, 1, 1}}, 0.1, VertexColors -> {Red, Blue}]]}]{Graphics3D[Cone[{{0, 0, 0}, {1, 1, 1}}, 1]], Graphics3D[{CapForm["Butt"], Tube[{{0, 0, 0}, {1, 1, 1}}, {1, 0}]}]}通过在 Tube 中指定不同的半径,获得一个截断的圆锥:
Graphics3D[{CapForm["Butt"], Tube[{{0, 0, 0}, {1, 1, 1}}, {1, 1 / 2}]}]用 ParametricPlot3D 产生一个参数锥形壳:
ParametricPlot3D[{Cos[θ] z, Sin[θ]z, z}, {θ, 0, 2 π}, {z, -1, 0}, Mesh -> None]由 ContourPlot3D 产生锥形壳的隐式指定:
ContourPlot3D[x ^ 2 + y ^ 2 == z ^ 2, {x, -1, 1}, {y, -1, 1}, {z, -1, 0}, Mesh -> None]ImplicitRegion 可以表示任何 Cone 区域:
Subscript[ℛ, 1] = ImplicitRegion[0 ≤ Subscript[t, 1] + Subscript[t, 2] + Subscript[t, 3] ≤ 3 && Subsuperscript[t, 1, 2] + Subsuperscript[t, 2, 2] + Subscript[t, 2] (12 - 7 Subscript[t, 3]) + Subscript[t, 1] (12 - 7 Subscript[t, 2] - 7 Subscript[t, 3]) + Subscript[t, 3] (12 + Subscript[t, 3]) ≤ 18, {Subscript[t, 1], Subscript[t, 2], Subscript[t, 3]}];
Subscript[ℛ, 2] = Cone[{{0, 0, 0}, {1, 1, 1}}, 2];RegionEqual[Subscript[ℛ, 1], Subscript[ℛ, 2]]巧妙范例 (3)
Graphics3D[Table[{EdgeForm[Opacity[.3]], Hue[RandomReal[]], Cone[RandomReal[10, {2, 3}]]}, {20}]]Graphics3D[{Opacity[0.3], EdgeForm[], Table[{ColorData["Rainbow"][Rescale[c, {0, 2Pi}]], GeometricTransformation[Cone[], RotationTransform[c, {-1, 2, -6}, {1, 0, 0}]]}, {c, 0, 2Pi, 2Pi / 18}]}]Graphics3D[{Opacity[.3], EdgeForm[Opacity[.3]], Table[Cone[{{0, 0, 0}, {0, 0, 2r}}, r], {r, 1, 5}]}, Boxed -> False]相关指南
-
▪
- 图形对象 ▪
- 基本几何区域 ▪
- Graphics Primitives Gallery ▪
- 立体几何 ▪
- 符号图形语言
文本
Wolfram Research (2008),Cone,Wolfram 语言函数,https://reference.wolfram.com/language/ref/Cone.html (更新于 2014 年).
CMS
Wolfram 语言. 2008. "Cone." Wolfram 语言与系统参考资料中心. Wolfram Research. 最新版本 2014. https://reference.wolfram.com/language/ref/Cone.html.
APA
Wolfram 语言. (2008). Cone. Wolfram 语言与系统参考资料中心. 追溯自 https://reference.wolfram.com/language/ref/Cone.html 年
BibTeX
@misc{reference.wolfram_2026_cone, author="Wolfram Research", title="{Cone}", year="2014", howpublished="\url{https://reference.wolfram.com/language/ref/Cone.html}", note=[Accessed: 14-September-2026]}
BibLaTeX
@online{reference.wolfram_2026_cone, organization={Wolfram Research}, title={Cone}, year={2014}, url={https://reference.wolfram.com/language/ref/Cone.html}, note=[Accessed: 14-September-2026]}
